Wang tiles were invented by Hao Wang in 1961 for mathematical reasons, but they find great use in games for making tile based art which gives results that don’t look tiled – both with 2d tiled textures, as well as 3d tiled models.
Apparently Wang tiles are also able to execute Turing machines, and so are thus Turing complete – meaning they can execute any program.
That is a pretty amazing and perplexing statement, so this post explores that a bit.
Wang Tiles Overview
Wang tiles are rectangular tiles where each edge will only fit with other specific edges, but that for any specific edge, there is more than one possible tile that can fit with that edge. By fit with that edge, I mean they are seamless when put together, without any visual artifacts to hint at there actually being a seam between the tiles.
This is useful for graphics because this lets you have seamless tiled graphics, but the specific configuration of how the tiles are placed can be completely randomized, so long as their edges are all compatible. The result is tiled graphics that doesn’t look at all tiled, due to visible patterns being much less noticeable than with traditional tiled graphics.
For graphical examples, a little more info and some links to some shadertoys check this out: Wang Tiling
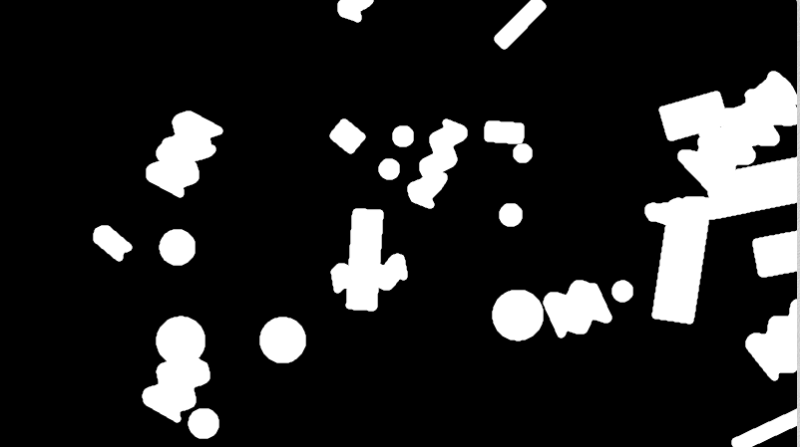
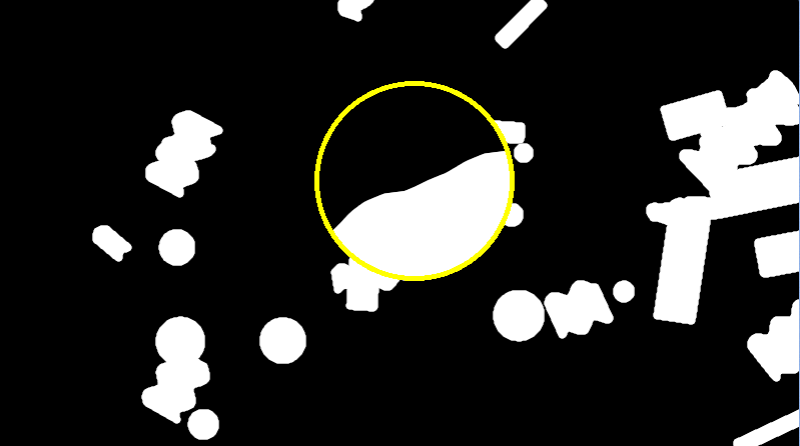
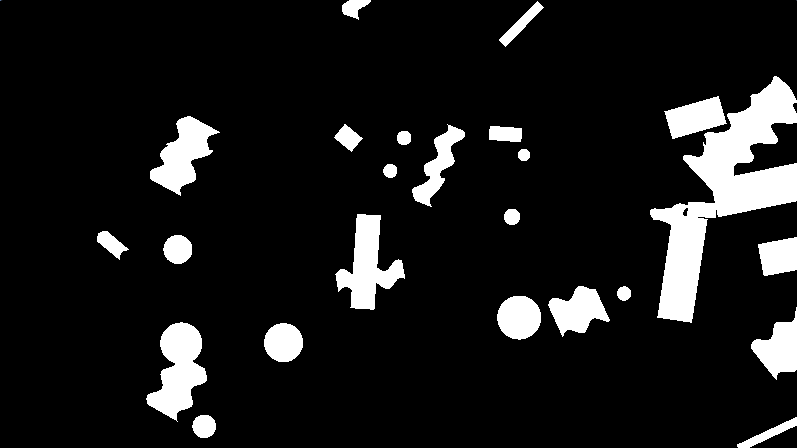
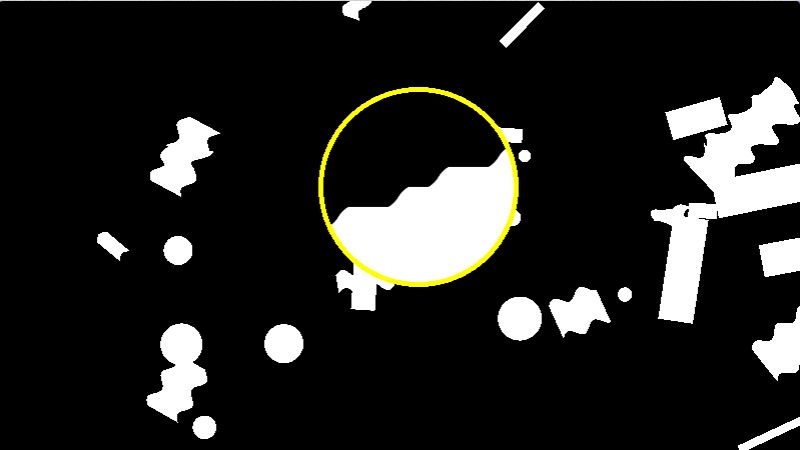
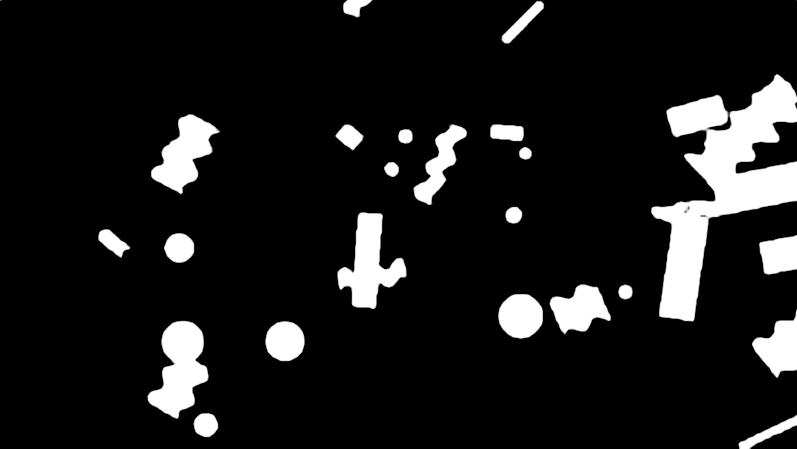
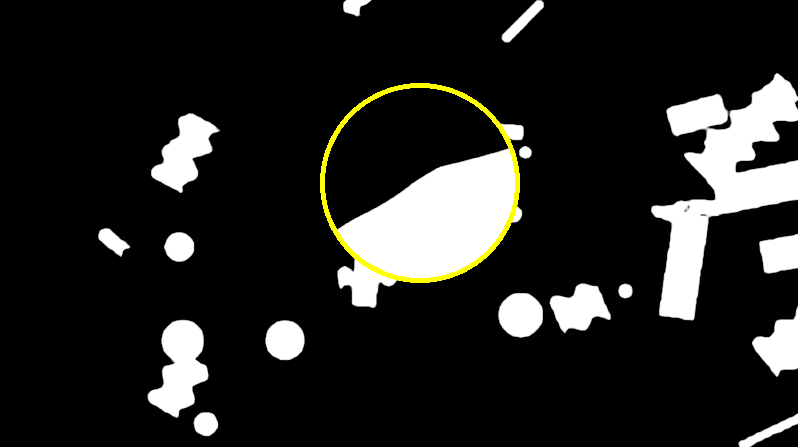
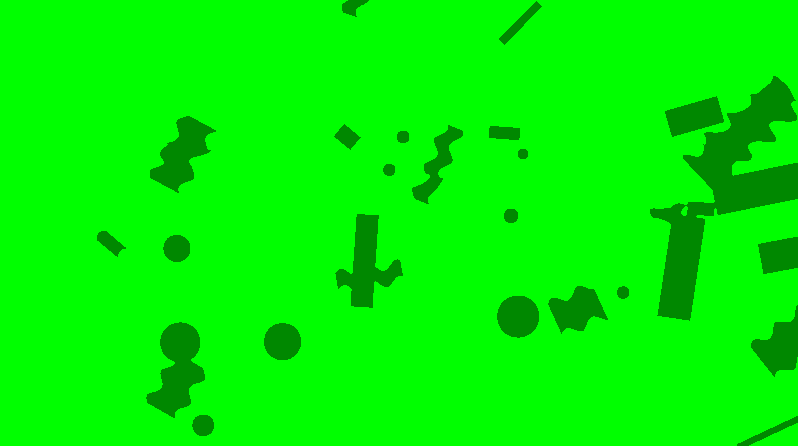
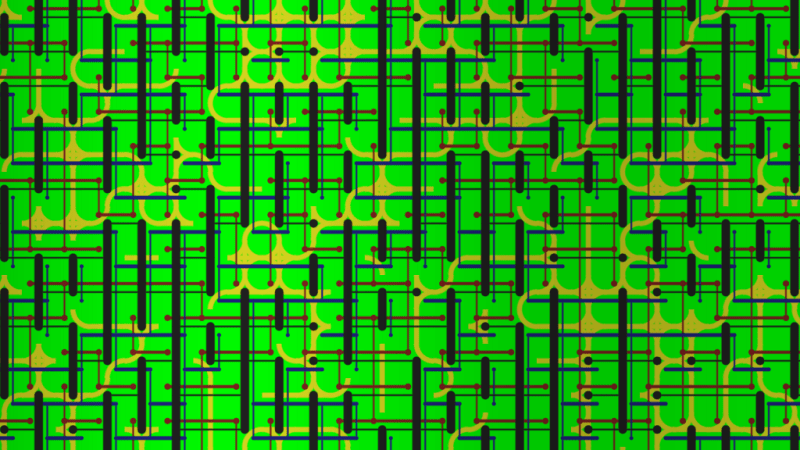
Here is an example I made. The graphics are programmer art but hopefully you get the idea. This was made with 16 tiles, where there were two different edge types per edge.
Turing Machine Overview
Turing machines were invented in 1936 by Alan Turing as a generic computing machine that was proven to be able to execute any algorithm.
The turing machine is made up of a few main components: the memory tape, the read/write head, and the state machine.
The memory tape is infinitely long, so has infinite storage, and is initialized to all zeroes to start out.
The read/write head starts at a position on the tape, and can read or write values, and also move left or right on the tape.
The state machine controls the read/write head.
The state machine knows what state it is in and has rules about what to do in each state when it reads a value from the tape.
For instance, in state A, if a 0 is read from the tape, the rule may be to write a 1 to the current position on the tape, move the read/write head to the right, and go to state B. State B may have completely different logic, and could either transition back to state A, state in state B, or move to another state entirely.
Using simple state transition logic like that, any computer algorithm can be performed.
In a Turing machine there can also be a “Halt State” which means the program is finished executing and the answer it was trying to calculate has been calculated.
Looking at some programs, you can easily see that they will halt eventually, or that they will be an infinite loop and never halt. Some programs in-between are complex and can’t very easily be determined if they will ever halt or not. Turing proved that there is no general solution to whether a Turing machine (aka any computer program) will halt or not, and this is called the Halting Problem. In general, the only way to know if a program will halt or not is to wait and see. So, effectively the answers to whether a program in general will halt or not are “yes” and “not yet” – although for many specific programs you can in fact see that they will halt eventually if you were to run them.
Wang Tile Computation
It turns out that Wang tiles can simulate a Turing machine, and so are “Turing complete” meaning that they too can perform any computer algorithm.
To make this happen, we’ll make a column of tiles that represent the state of the Turing machine at a specific point in time, starting with time 0 at the left most column. We’ll place tiles in the column to the right making sure all edge rules are respected, and then do the column to the right of that one etc until the program halts (or forever if it doesn’t halt). If we set up our set of tiles correctly, the act of satisfying the edge rules as we place our tiles is enough to execute the Turing machine.
Let’s walk through a simple example where we have the following state machine logic rules:
- When in state A, if a 0 is read, we will write a 1, move the read/write head down and move to state B.
- When in state A, if a 1 is read, we will halt (enter the halt state).
- When in state B, if a 0 is read, we will write a 1, move the read/write head up and move to state A.
- When in state B, if a 1 is read, we will halt (enter the halt state).
Tape Memory Storage
The first thing we need is persistent storage of memory for the tape. For this, we’ll need the following two tiles:
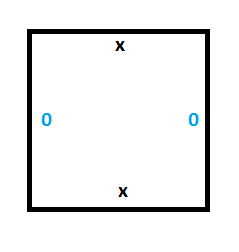
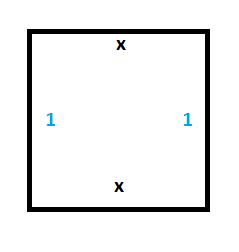
To see this working, we can set up a section of tape with some values (make a column of wang tiles), and we can see that the only valid wang tiles to place next to the starting column are tiles which propogate the 0 and the 1 values forward in time without modifying them.
In the diagram below, we initialize the tape to 0101 in the left most column (time 0). By only placing down tiles with compatible edges you can see that our memory values persist forever. Our memory storage is implemented, huzzah!
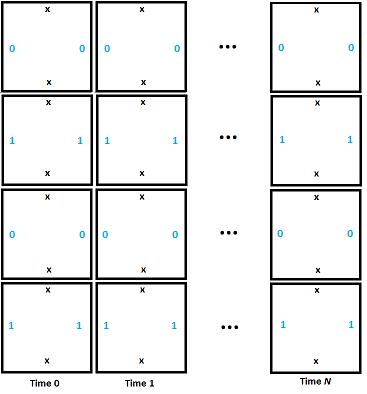
We’ll start our example with all memory initialized to 0, but the above shows that we can have persistent memory.
Read/Write Head State Machine
The read/write head of the Turing machine is represented as part of the edge information. In this way, besides an edge storing the 0 or 1, if that is where the read/write head is, it also stores the state of the state machine.
Our example uses two states (besides the halt state): A and B. If a 1 is read in while being in either state A or B, the program halts.
To handle that, we need the tiles below:
Now that we have the rules for entering the halt state done (rule #2 and rule #4), we have to figure out how to implement the rules that control switching from one state to another (rule #1 and rule #3).
Moving the Read/Write Head
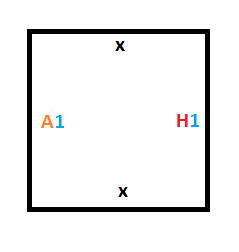
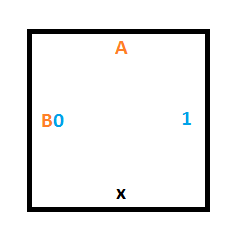
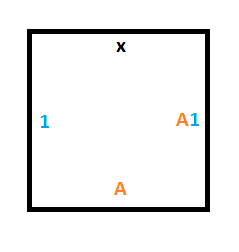
Rule #1 says that if we are in state A and read a 0, we should write a 1, move the read/write head down and move to state B.
We’ll need this tile to cause reading a 0 in state A to write a 1 as output, and to tell the tile below to move to state B.
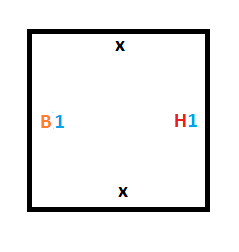
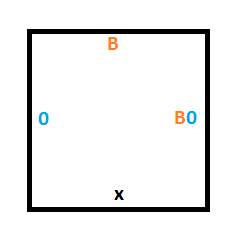
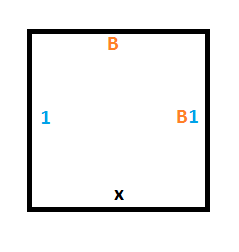
The tile below that one could either be a 0 or a 1, and without knowing which, we want it to keep it’s value but accept the read/write head and be in state B. To do that we need two tiles, one for if there is a 0 on the tape at that position, and another for if there is a 1 on the tape.
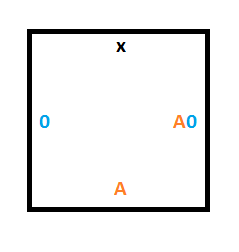
Rule #3 says that if we are in state B and read a 0, we should write a 1, move the read/write head up and move to state A.
To do that, we’ll need a similar construction as for rule #1 but we are moving up instead of down. These 3 tiles will give us what we need:
Starting Column Tiles
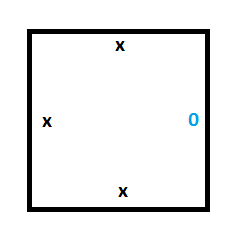
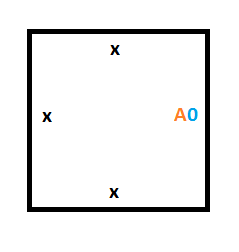
We are going to treat the boundaries of our simulation area as if they have edges of “x”.
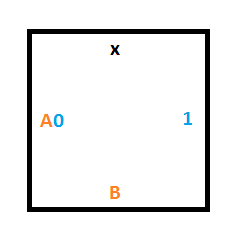
This means that to make our starting column (the Turing machine at time 0), we are going to need 2 special tiles. One tile will be for storing a 0 on the tape, which is what the tape is initialized to, and the other tile will be for storing the position of the read/write head in state A, which is our starting state.
Here are those two tiles:
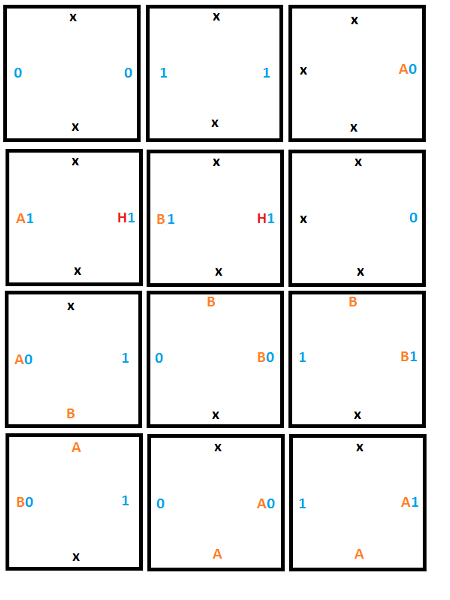
Final Tileset
Here’s the full set of 12 tiles that we are going to use:
Full Simulation
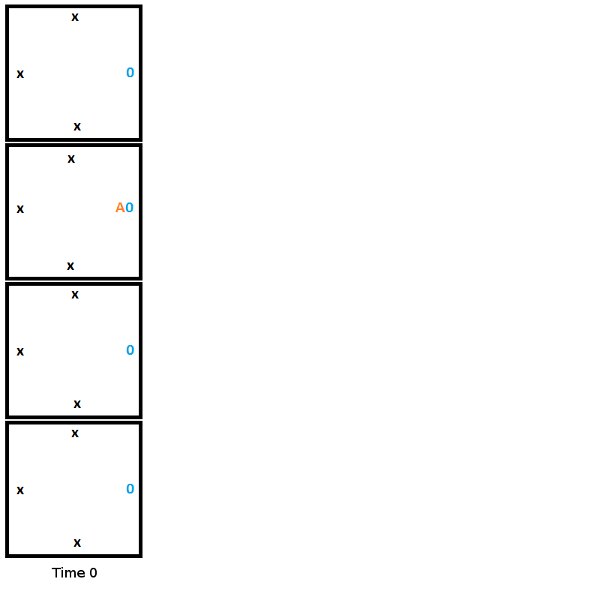
Here is the initial setup at time 0 for our Turing machine. Note that this is one possible starting state, but this is the starting state we are choosing. We are not leaving it up to chance where the read/write head starts, or if it is even present at all. If we only followed edge rules we may get 4 read/write heads or 0, or anything in between.
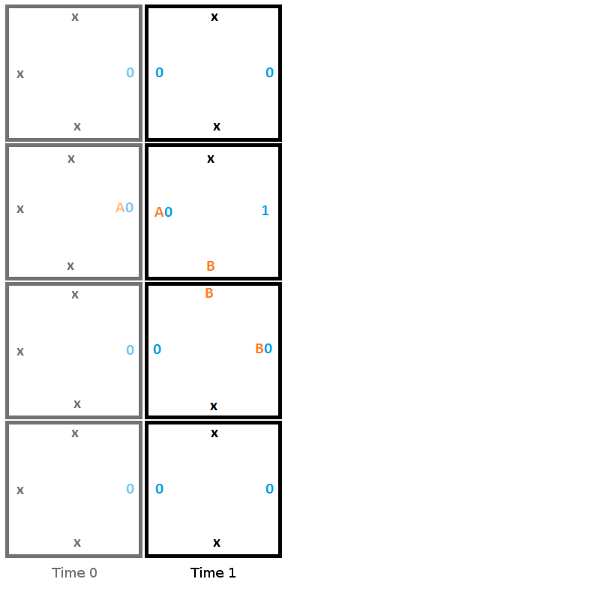
From here, to build the second column, we start from the top and work towards the bottom, choosing the tile that fits the constraints of the edge it touches. In this first step, the head reads a 0, writes a 1, moves down, and moves to state B.
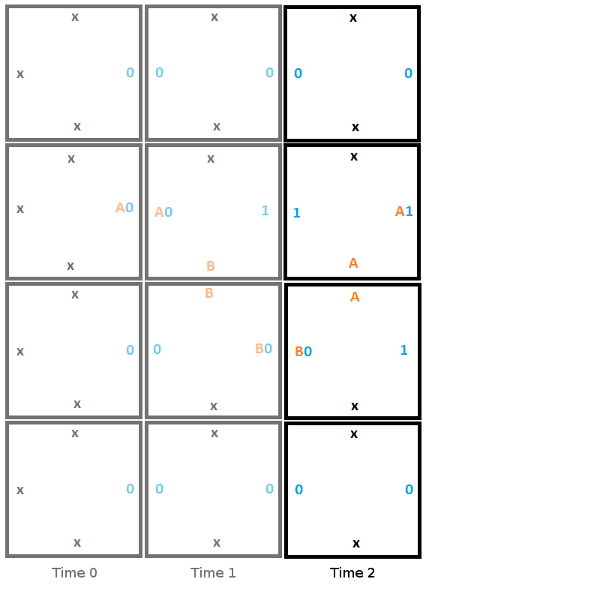
Heres is the second step, where the read reads a 0, writes a 1, moves up, and moves to state A.
Here is the final step, where the head reads a 1 and enters the halt state, signifying that the program has terminated.
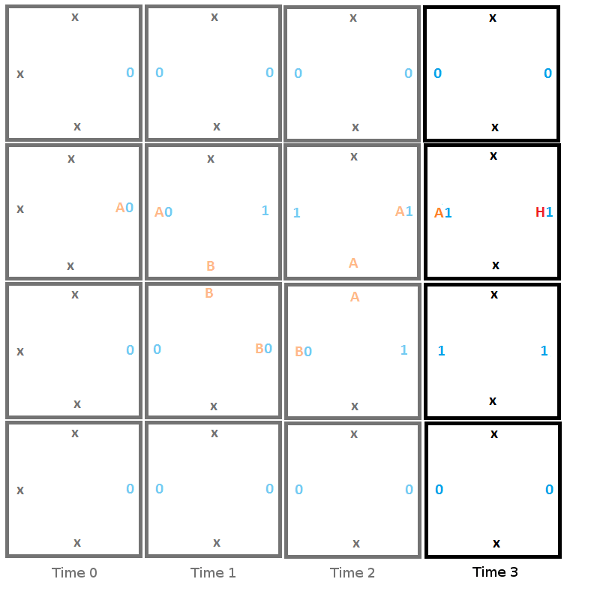
The program halted, and gave an output value of “0110” or 6. This output isn’t really meaningful but other programs can give output that is meaningful. For instance you could have a Turing machine add two numbers, and the output would be the sum of those two numbers.
An Important Detail
There is an important detail that the above doesn’t address, and that many explanations of Wang tile Turing machines don’t seem to talk about.
When placing the second tile for time 2, the only constraint from the edges is that the tile must have an x on top and a 1 on the left. This actually makes it ambiguous which tile should be chosen between the two tiles below.
How do we choose the right one then?
The answer is that you make a guess and just choose one. If the wrong one was chosen in this case, when we moved to the next tile, we’d be looking for a tile which had an x on top and a B0 on the left. There is no such tile so you’d be unable to place a tile. When this happened, you’d take a step back to the last tile, and try one of the other possibilities.
So, unfortunately there is some literal trial and error involved when simulating Turing machines with Wang tiles, but it is fairly manageable at least. It definitely makes it a bit more complex to calculate in a pixel shader if you were so inclined (or other massively parallel processing units), but it shouldn’t be that much more costly.
Closing & Links
Some of the links below talk about Wang tiles and Turing machines, but don’t seem to strictly be Turing machines anymore. For instance, you might notice that some examples allow data to travel “back in time” where after the program halts, the answer is in the tape at time 0 of the Turing machine, even though that data wasn’t actually there at time 0. This shows that Wang tiles can do computation in their own right, beyond simulating Turing machines, but I’m not really sure what that technique itself would be called.
Also if you are wondering if this is useful to do computation with Wang tiles, I’m not really sure of any practical usage cases myself. However, apparently scientists have found that DNA can act much like Wang tiles act, where they will fit together only if edges are compatible. Because of this, there is ongoing research into DNA based computation that is based on the work of Wang tile computation. pretty interesting stuff!
Here is a shadertoy implementation of wang tiles computing prime numbers in a webgl pixel shader:
Shadertoy: WangTiles : PrimeGenerator
Here are some great videos on Turing machines and the halting problem:
Turing Machines Explained – Computerphile
Turing & The Halting Problem – Computerphile
Here are some other links:
Computing With Tiles
Wikipedia: Wang Tile
Wang Tiles and Turing Machines
Wang Tiles – 1
Here are some academic papers:
Computing With Tiles
Computability of Tilings


![value = result[0] + result[1] + result[2]](https://s0.wp.com/latex.php?latex=value+%3D+result%5B0%5D+%2B+result%5B1%5D+%2B+result%5B2%5D+&bg=ffffff&fg=666666&s=0&c=20201002)