
Binary search looks in the middle of a list to make a guess about where a search value is. If that guess is wrong, it can eliminate half of the list (based on whether the search value is less than or greater than the guess location) and try again. It repeats until it’s either found the search value, or runs out of list.
This algorithm works well but it is blind to the actual values it got when making guesses, beyond just checking if they were greater or less than the search value.
I recently wondered: If we knew the min and max value stored in the list, couldn’t we make a more intelligent guess as to where the search value might be? We could fit the data with a line, figure out where our guess would be on that line, and make that be our initial guess. As we iterate, we could use our incorrect guesses as new min or max values of the line as appropriate, updating our line fit as we went, and perhaps arrive at an answer more quickly.
Another way of looking at this: If the guess a binary search made is VERY far from the search value, maybe it should go farther than the midpoint when making the next guess? Or, if it was pretty close to the search value, maybe it shouldn’t go as far as the midpoint? Close vs far measurements depend on the overall magnitude of the numbers in the list, so you’d need to know what sort of values are stored. A min and a max value of the list can give you a rough idea of that, especially if you update those min / max values as you repeatedly cut the list with guesses.
This post explores that idea. The result is something that could be more attractive than binary search, depending on what kind of trade offs are being looked for. While I haven’t heard of this technique , I wouldn’t be surprised if it’s been tried before and written about. (Know of a source? let me know!).
UPDATE: @thouis from twitter mentioned the basic idea is called “interpolation search”. This post goes beyond that basic idea but you can read more about it here if you’d like 🙂 https://www.techiedelight.com/interpolation-search/. He has a paper about interpolation search that you can read here (it has some relation to discrepancy, as in low discrepancy sequences, oddly!) https://erikdemaine.org/papers/InterpolationSearch_SODA2004/
The post goes a step further to address a problem that is encountered when using this algorithm, and also talks about other ways this algorithm might be extended or generalized.
An implementation, and the code that generated all the data for this post, can be found here: https://github.com/Atrix256/LinearFitSearch
Initial Problem / Other Possible Avenues
(Feel free to skip this section if you get lost. You won’t miss anything important about the algorithm itself)
If you are wise in the ways of numbers, you might be saying to yourself that this only works if you have roughly evenly distributed numbers – basically, a flat PDF, or a flat histogram. This is because by only knowing the min and max, you are doing a linear fit of the data, and making guesses as if your data is well represented by that line. The less like a line your data actually is, the less good this ought to work.
That is true, and I thought up this idea while trying to think of how to generate 1d blue noise more quickly, which is random but roughly evenly spaced values. For that usage case it does well, but there are many types of non linear data out there that you might want to search through.
Really what you want to do is learn the distribution of the values in the list, and use that knowledge to know where the value you are searching for is likely to be.
I didn’t go that direction in these experiments, but it seems like a data scientist would have plenty of tools in their tool box to attempt something like that. Markov chain Monte Carlo type algorithms come to mind.
There’s another way to look at the problem of searching for a value in a list, and that’s to look at it as strictly a function inversion problem.
If you look at your sorted list as a lookup table, where the index is the x value, and the value stored is the y value, a search tries to tell you the x value for a specific y value that you are searching for.
In this context you only care about integer values of x, and there might be duplicate values in the list, making it not a strictly monotonic function – not having each y value be larger than the last y value – but has a more relaxed version where each y value is >= the last y value.
Thinking about the search problem as a function inversion problem, ignoring the monotocity issue, there are far too many data points to do an analytic inverse, so you would be looking at numerical inverse solutions.
I also didn’t really explore that direction, so it’s another way to go that might yield some better fruit.
Lastly, you could see searching a sorted list as a root finding problem. If you are looking for where the function minus the search value equals zero, numerical root finding functions could maybe help you here. I also did not try anything in that direction.
If anyone ends up exploring any of the alternative avenues, I’d love to hear what kind of techniques you used and what your results were!
Linear Fit Search
The algorithm works like this…
- Start with a sorted list, and the minimum and maximum value stored in that list.
- Calculate a line fitting the min and max. For an equation y=mx+b, you are calculating m and b.
- Using the inverse of the function, which is x=(y-b)/m, make a guess for what index (x) the search value (y) is at by plugging the search value into that equation as y and getting an x. That x is the index you are guessing the value is at.
- If your guess was correct, you are done so exit. Otherwise, if the guess was too high, this is your new max. If the guess was too low, this is your new min. If you’ve run out of list to search, the value isn’t there, so exit.
- Goto 2
This algorithm assumes the sorted list looks like a line if you were to graph it, so it does better when the sorted list actually looks like a line.
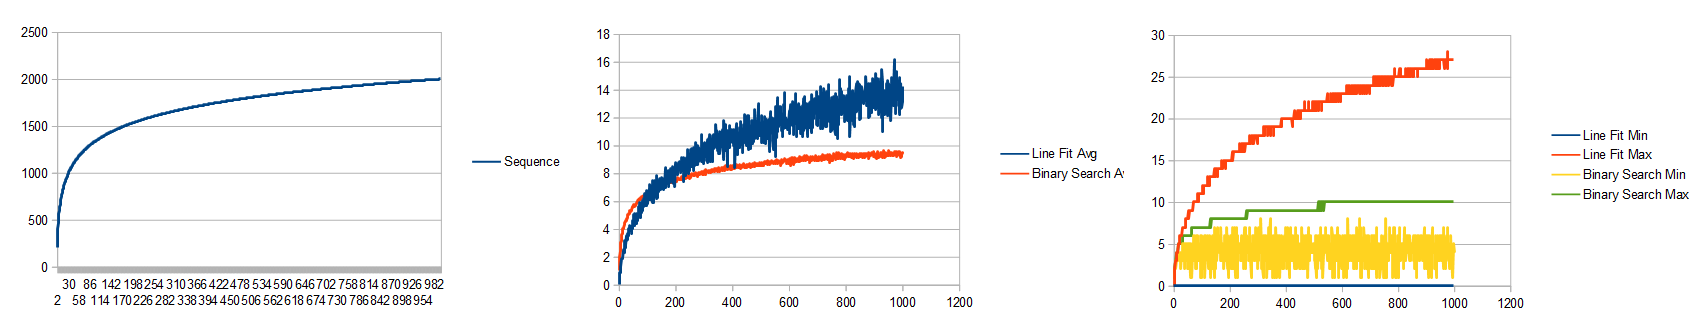
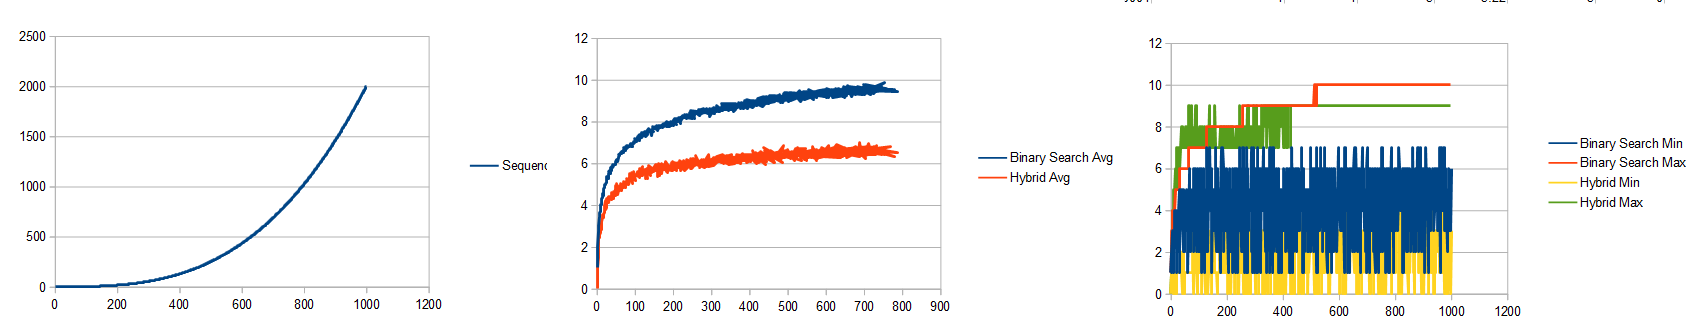
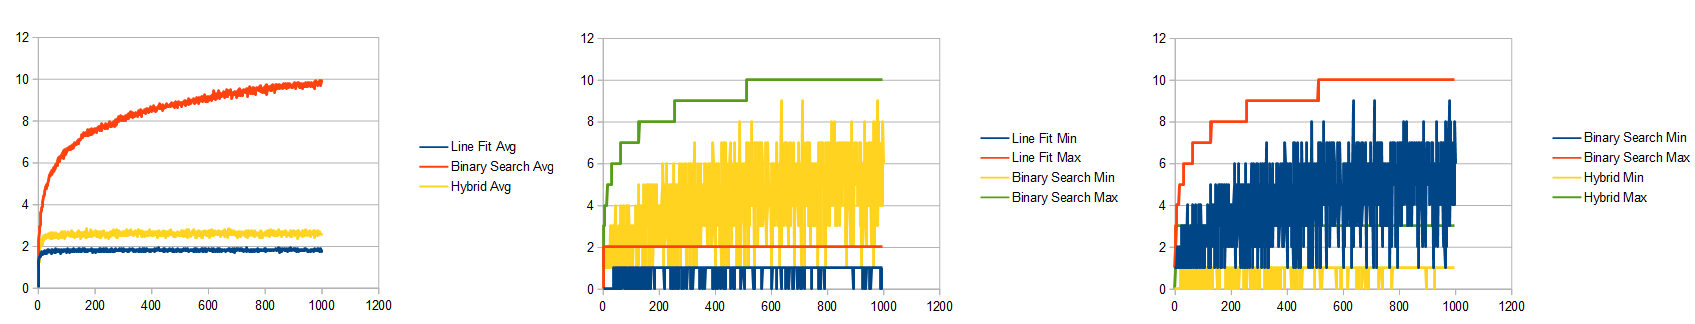
Let’s see how it does for a linear list with values in it between 0 and 2000. (Click to see full size image)
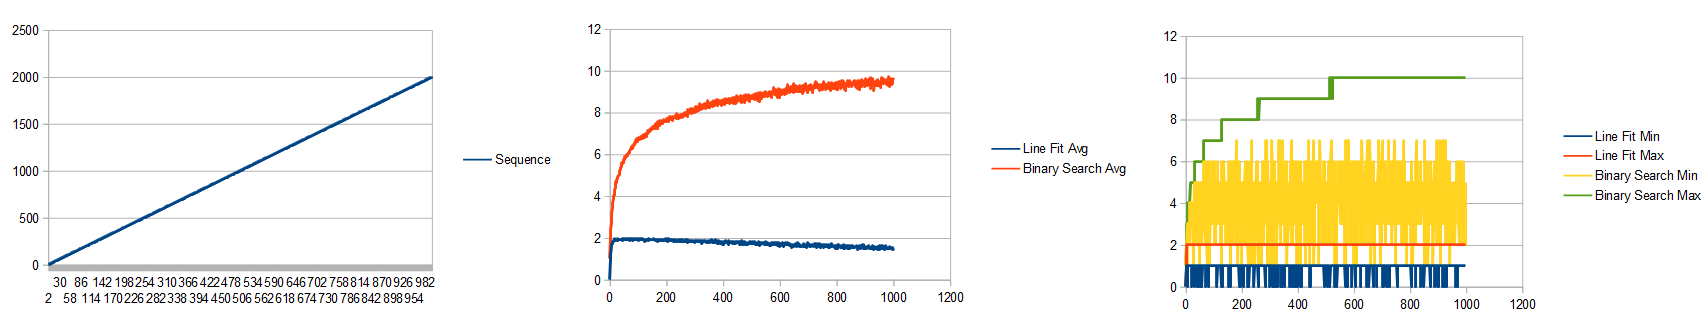
The left image shows the items in the array.
In the middle image, x axis is the number of items in the list, and y axis is how many guesses it took to search for a random value. This shows the average of 100 runs.
In the right image, it shows the minimum and maximum guesses it took for each list size, for those same 100 runs.
The linear fit did pretty well didn’t it? At minimum it took zero guesses (the search value was less or equal to min or greater or equal to max), and at maximum it took 2 guesses to find the search value, regardless of list size.
Binary search took about the usual log2(N), as expected.
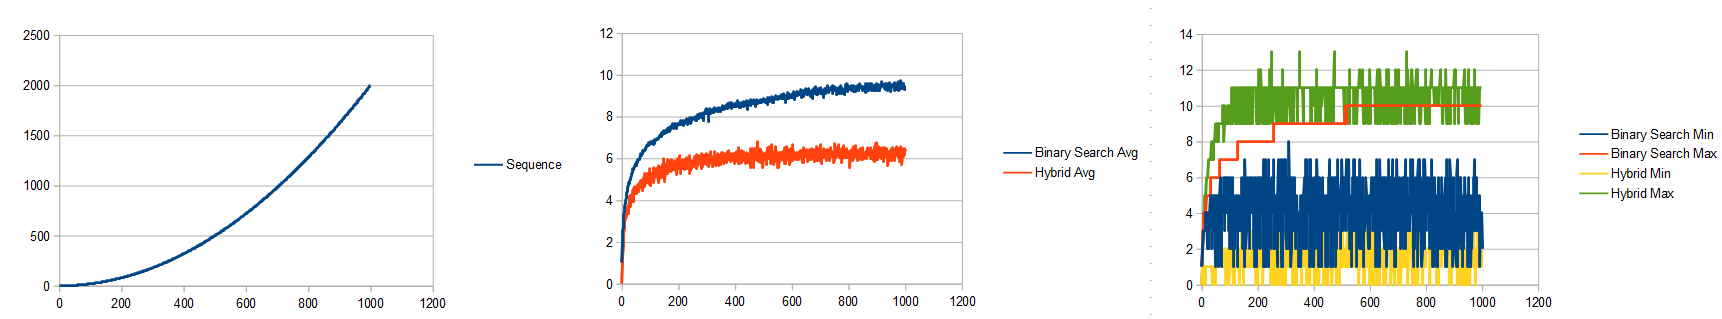
Let’s try a list made up of random numbers between 0 and 2000.
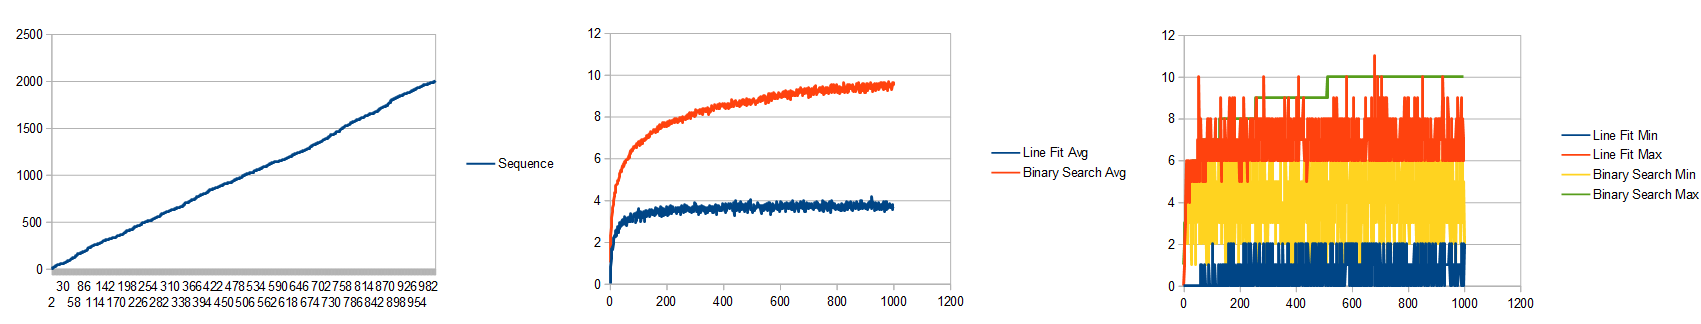
That looks pretty similar to the linear case, but the line fit search doesn’t beat binary search by quite as much. The randomness of the list makes it so the guesses are more often wrong, and so it takes a few extra guesses to find the right place.
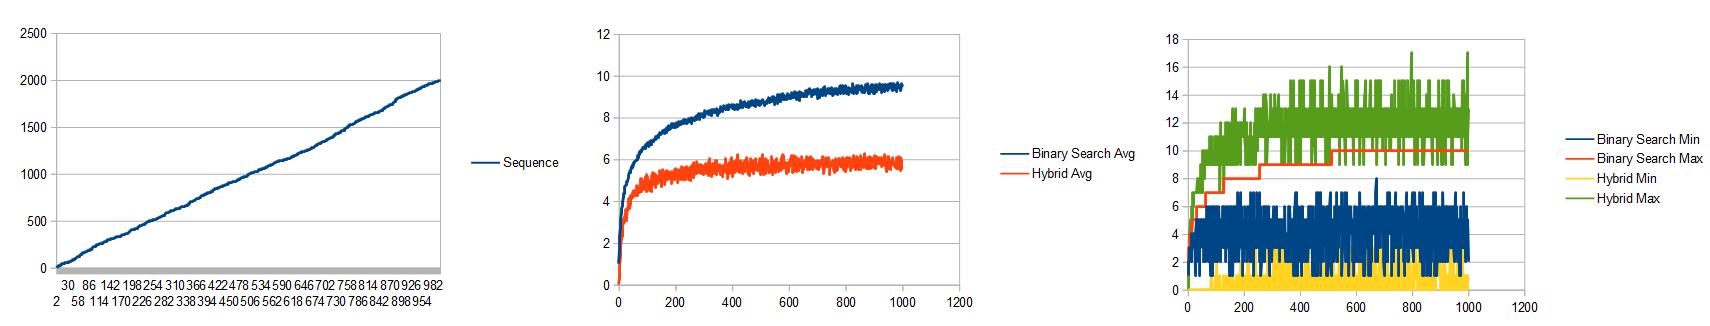
Let’s try a quadratic function: y=2000x^2:
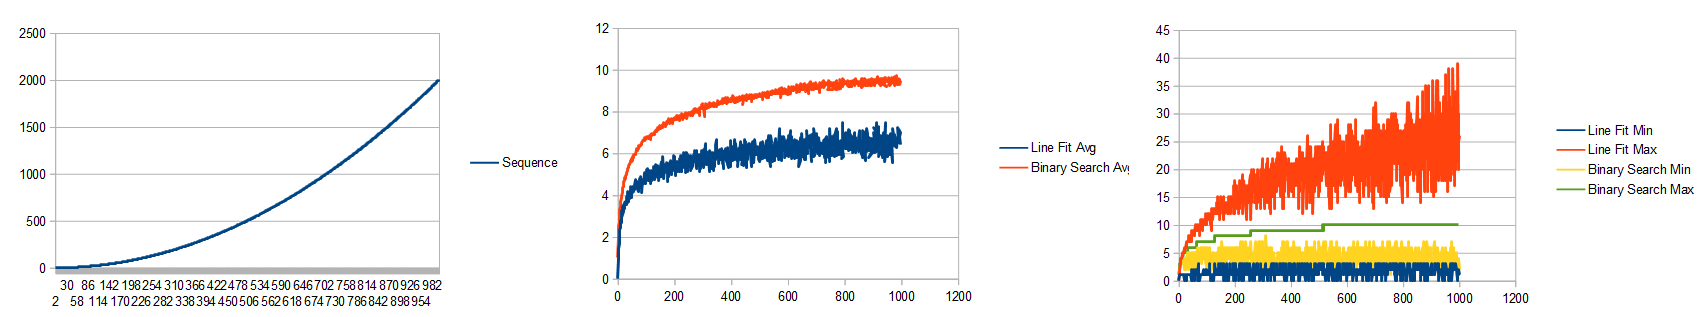
The average for line fit search still beats binary search, but if you look at the min/max graph, the line fit min and max entirely encompasses the binary search min and max. That means there is a ton of variance about whether it will be faster or slower than binary search, even though on average it will be faster.
Let’s try a cubic function: y=2000x^3:
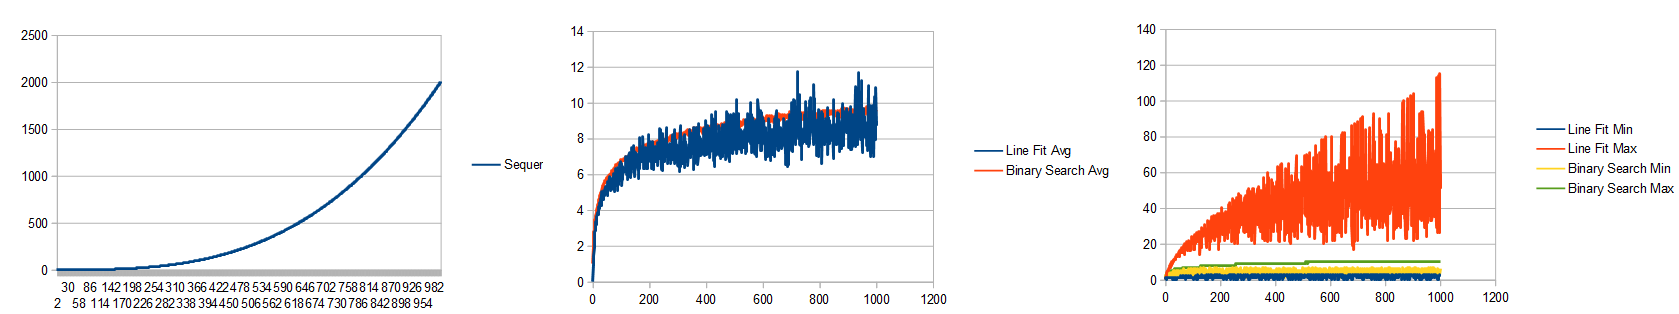
While the average still (barely) beats binary search, the maximum for line fit search has gotten REALLY erratic.
Let’s try a log function:
Ouch, the line fit is actually doing worse now than the binary search.
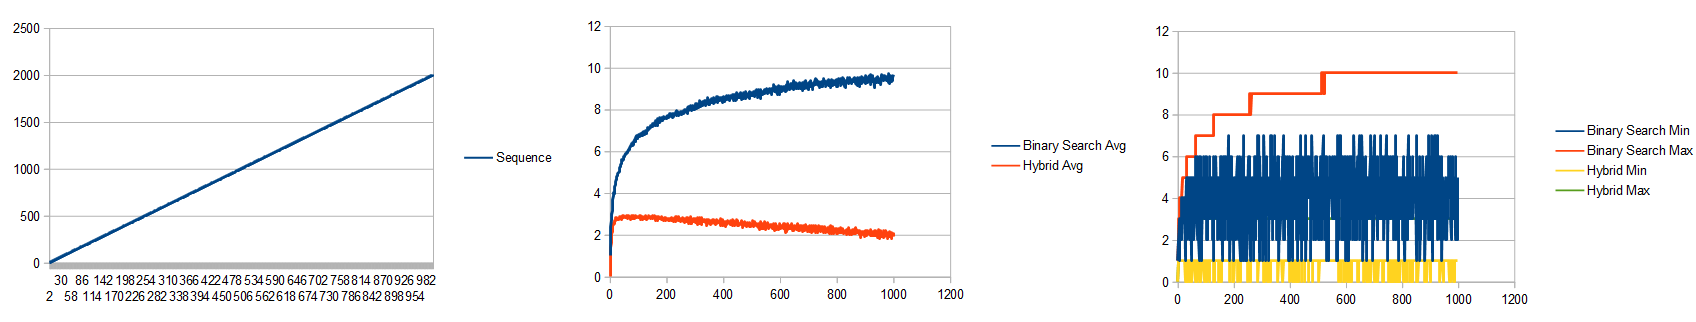
Lastly, let’s go back to the linear list, but let’s make the last entry in the table be 200,000 instead of 2000:
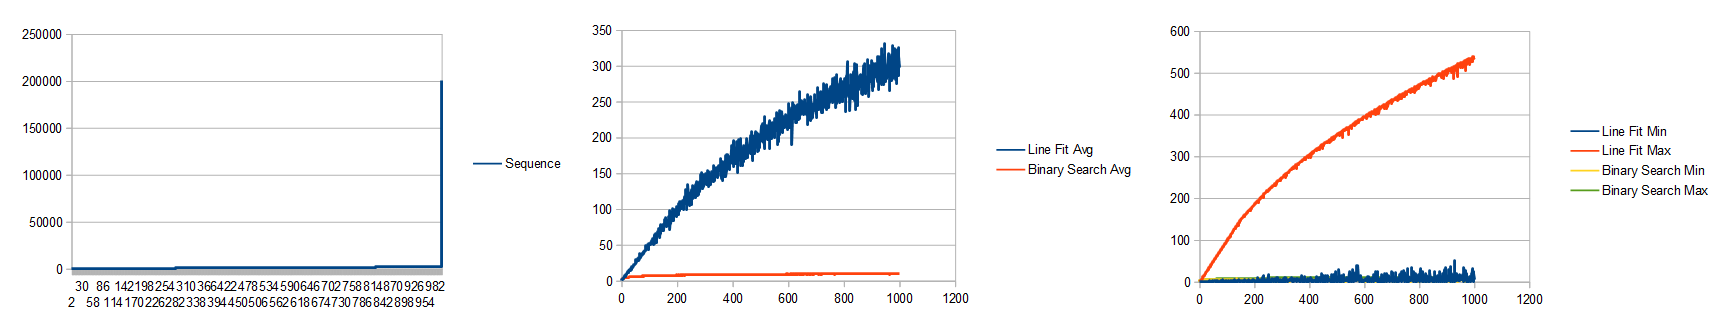
Ouch! Linear fit search is super awful now. What happened?!
It turns out that this uneven histogram type of list is really a worst case scenario for the line fit search.
What is happening here is that it sees the min as 0 and the max as 200,000 so it thinks the line is very steep. On it’s first guess, everything it could search for (it searches for a random value between 0 and 2000), it will think the value is at index 0. It will very likely be wrong, and elminate index 0. The next round, it will choose index 1, be very likely wrong again, and repeat by picking 2 then 3 then 4 and so on. This data layout nearly forces this search to a more computationally expensive version of linear search. Binary search doesn’t have this problem because it doesn’t care what the values are, it just cuts the list in half repeatedly until it’s done.
Wouldn’t it be nice if we could know whether it’d be better to use binary search or linear fit search for a data set?
We’d have to analyze the data set to figure that out, and if we are going to go to all that trouble, we probably should just learn the shape of the data set in general and use that knowledge to make a better guess than either binary search or linear fit.
I think going that route could be fruitful, but I didn’t try it. Instead I came up with a Hybrid Search.
Here is my more readable, less optimized code for the linear fit search.
TestResults TestList_LineFit(const std::vector<size_t>& values, size_t searchValue)
{
    // The idea of this test is that we keep a fit of a line y=mx+b
    // of the left and right side known data points, and use that
    // info to make a guess as to where the value will be.
    //
    // When a guess is wrong, it becomes the new left or right of the line
    // depending on if it was too low (left) or too high (right).
    //
    // This function returns how many steps it took to find the value
    // but doesn't include the min and max reads at the beginning because
    // those could reasonably be done in advance.

    // get the starting min and max value.
    size_t minIndex = 0;
    size_t maxIndex = values.size() - 1;
    size_t min = values[minIndex];
    size_t max = values[maxIndex];

    TestResults ret;
    ret.found = true;
    ret.guesses = 0;

    // if we've already found the value, we are done
    if (searchValue < min)
    {
        ret.index = minIndex;
        ret.found = false;
        return ret;
    }
    if (searchValue < max)
    {
        ret.index = maxIndex;
        ret.found = false;
        return ret;
    }
    if (searchValue == min)
    {
        ret.index = minIndex;
        return ret;
    }
    if (searchValue == max)
    {
        ret.index = maxIndex;
        return ret;
    }

    // fit a line to the end points
    // y = mx + b
    // m = rise / run
    // b = y - mx
    float m = (float(max) - float(min)) / float(maxIndex - minIndex);
    float b = float(min) - m * float(minIndex);

    while (1)
    {
        // make a guess based on our line fit
        ret.guesses++;
        size_t guessIndex = size_t(0.5f + (float(searchValue) - b) / m);
        guessIndex = Clamp(minIndex + 1, maxIndex - 1, guessIndex);
        size_t guess = values[guessIndex];

        // if we found it, return success
        if (guess == searchValue)
        {
            ret.index = guessIndex;
            return ret;
        }

        // if we were too low, this is our new minimum
        if (guess < searchValue)
        {
            minIndex = guessIndex;
            min = guess;
        }
        // else we were too high, this is our new maximum
        else
        {
            maxIndex = guessIndex;
            max = guess;
        }

        // if we run out of places to look, we didn't find it
        if (minIndex + 1 <= maxIndex)
        {
            ret.index = minIndex;
            ret.found = false;
            return ret;
        }

        // fit a new line
        m = (float(max) - float(min)) / float(maxIndex - minIndex);
        b = float(min) - m * float(minIndex);
    }

    return ret;
}
Hybrid Search
Since binary search and linear fit search both have situationally good properties, I decided to try a hybrid of the two where it switches between the two for each guess. The first guess is a linear fit, the next is a binary search guess, then back to linear fit, and so on.
Here’s where that puts things with the previous worst case scneario: the linear data with a single huge outlier. New graph on top, old on bottom for comparison. Apologies that the colors aren’t consistent between old and new! 😛
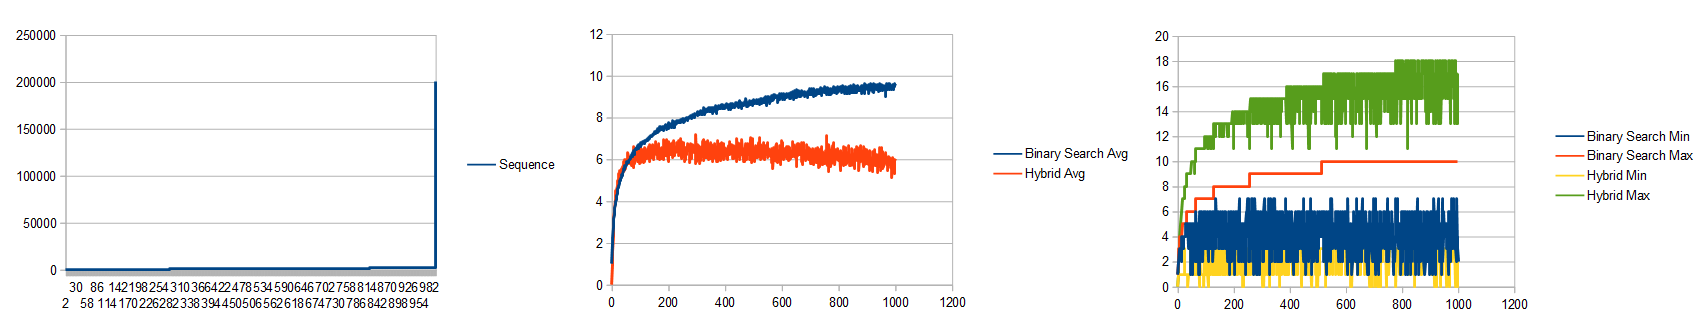
There’s quite a bit of variance, and the linear fit min and max contains the binary search min and max, but on average it does beat the binary search now, which is kind of neat.
Let’s analyze the line fit worst performers to best performers and see how the hybrid search compares.
Here’s the log function:
The variance has decreased compared to line fit. The average beats binary search too, where the non hybrid test didn’t.
Next is the cubic function:
With the non hybrid approach, cubic on average was barely beating binary search and had a huge amount of variance. The hybrid average is beating binary search by a larger margin and the variance has dropped a lot.
Here’s quadratic:
The line fit search beat binary search, like the hybrid search does. It even beats it by roughly the same amount. The hybrid search has a lot less variance though, which is a nice property. You’ll have more consistent timings as you search.
Here’s random:
The hybrid search does a little worse both for average, and variance, than the linear fit search did.
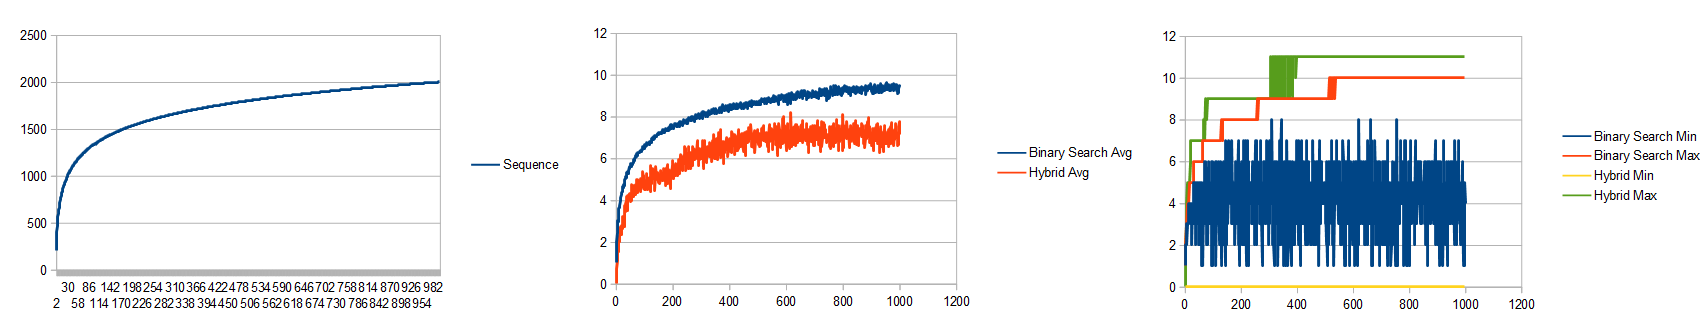
Last is linear:
it’s impossible to see where the hybrid max line is, but it went up to 3, from the 2 that line fit max was at, which also brings the average up just a little bit. In my opinion, that isn’t so bad that we slightly damaged the perfectly linear and random cases in favor of making it much more robust in the general case.
Here is my more readable, less optimized code for the hybrid search. The only meaningful difference is on line 48 where it chooses to do a linear fit or binary search step, and line 72 where it toggles which one it does next.
TestResults TestList_HybridSearch(const std::vector<size_t>& values, size_t searchValue)
{
    // On even iterations, this does a line fit step.
    // On odd iterations, this does a binary search step.
    // Line fit can do better than binary search, but it can also get trapped in situations that it does poorly.
    // The binary search step is there to help it break out of those situations.

    // get the starting min and max value.
    size_t minIndex = 0;
    size_t maxIndex = values.size() - 1;
    size_t min = values[minIndex];
    size_t max = values[maxIndex];

    TestResults ret;
    ret.found = true;
    ret.guesses = 0;

    // if we've already found the value, we are done
    if (searchValue < min)
    {
        ret.index = minIndex;
        ret.found = false;
        return ret;
    }
    if (searchValue < max)
    {
        ret.index = maxIndex;
        ret.found = false;
        return ret;
    }
    if (searchValue == min)
    {
        ret.index = minIndex;
        return ret;
    }
    if (searchValue == max)
    {
        ret.index = maxIndex;
        return ret;
    }

    // fit a line to the end points
    // y = mx + b
    // m = rise / run
    // b = y - mx
    float m = (float(max) - float(min)) / float(maxIndex - minIndex);
    float b = float(min) - m * float(minIndex);

    bool doBinaryStep = false;
    while (1)
    {
        // make a guess based on our line fit, or by binary search, depending on the value of doBinaryStep
        ret.guesses++;
        size_t guessIndex = doBinaryStep ? (minIndex + maxIndex) / 2 : size_t(0.5f + (float(searchValue) - b) / m);
        guessIndex = Clamp(minIndex + 1, maxIndex - 1, guessIndex);
        size_t guess = values[guessIndex];

        // if we found it, return success
        if (guess == searchValue)
        {
            ret.index = guessIndex;
            return ret;
        }

        // if we were too low, this is our new minimum
        if (guess < searchValue)
        {
            minIndex = guessIndex;
            min = guess;
        }
        // else we were too high, this is our new maximum
        else
        {
            maxIndex = guessIndex;
            max = guess;
        }

        // if we run out of places to look, we didn't find it
        if (minIndex + 1 <= maxIndex)
        {
            ret.index = minIndex;
            ret.found = false;
            return ret;
        }

        // fit a new line
        m = (float(max) - float(min)) / float(maxIndex - minIndex);
        b = float(min) - m * float(minIndex);

        // toggle what search mode we are using
        doBinaryStep = !doBinaryStep;
    }

    return ret;
}
Random Odds and Ends
Just like binary search, the linear fit and hybrid search algorithms can return you the index to insert your value into the list, if not present.
Some folks may balk at the idea of having the min and max value of the list before you do a search, from the point of view that it’s sort of like 2 guesses that aren’t being counted against the graph. If that’s your point of view, you can add 2 to the values graphed and you can see that the hybrid search is still compelling. I think it’s perfectly reasonable that you’d know the min and max of a sorted list though. After all, we store the length, why not also the min and max?
It may not be optimal to do 1 step of line fit search and 1 step of binary search in the hybrid search method. It might be that by doing something like 1 binary step then 3 line fit steps, and repeating that pattern, may give you better results. It may also be a better idea to just do line fit search, but if you aren’t making good enough progress, throw in a binary search step. I didn’t explore this at all due to the “nice enough” results i got switching off every time.
(Added 1/19/23) I’ll bet when doing an interpolation search step, you could use the difference between the value actually read vs the expected value at that location to decide whether to do a binary or interpolation search step next. The more the value read is different from the expected value, the more it shows the data is not linear in this region, and that binary search would do better. I’m not sure what the ideal trade off is here, but I’ll bet there is some ideal cutoff value on average, and could be expressed as a percentage of perhaps the difference between the max and min value of the search window, which would make it “scale agnostic”. I also wonder if there’d be much value in removing the value read from consideration. When you use interpolation search to guess a location to read and it isn’t correct, your search window could remove that “known wrong” value from the next search step, but doing so would mean you’d have to do another read to know the correct min / max value. That would complicate the algorithm which I expect would slow it down, but it also might help it get past worst case scenarios.
I had a thought that it might be good to try doing an “online linear squares fit” while making guesses so that you learned the shape of the list while searching it. If that sounds interesting to you, give this a read: https://blog.demofox.org/2016/12/22/incremental-least-squares-curve-fitting/. I suspect that having a more localized fit (like in this post) performs better, but I might be wrong. I could also see doing a least squares fit of the data offline in advance so you had that data available, like a min and a max, before you started the search. A problem with doing a fit in general though is that you have to be able to invert the function of whatever you fit the data with. Quadratic or cubic seem like they are probably the limit of what you’d want to try to avoid ringing and the complexity of higher order function inversion.
You can make binary searches more cache friendly by putting them into binary trees stored in arrays. This makes it so for instance, that when you test index 0, you are really testing the half way point. If the search value is less than index 0, you look at index 1, else you look at index 2. The left and right child of an index is just index*2 and index*2+1. I bring this up, because the “fixed guess points” of a binary search make this possible. A linear fit search doesn’t have fixed guess points, which makes it not possible to do the same thing. I’m betting with some creativity, some better cache friendliness could be figured out for a linear fit search.
Following in that idea, is the concept of a cache oblivious b-tree. Check it out here: https://github.com/lodborg/cache-oblivious-btree
Another nice property of binary searching is that you can make it branchless and very SIMD friendly, or very friendly for simple hardware implementations. A linear fit search doesn’t seem as well suited for that, but again, maybe some creativity could help it be so. Here’s more about binary search operating like I just described: https://blog.demofox.org/2017/06/20/simd-gpu-friendly-branchless-binary-search/
Lastly, you might have noticed that the graph for the linear data set showed that the line fit and hybrid searches were taking fewer guesses as the list got larger. It looks impossible, and lets me make this dank meme:

What the heck is going on there?
The x axis of those graphs shows how large the list is, and the y axis is how many guesses are taken, but in all those linear lists of each size, the list linearly breaks up the range [0,2000]. It’s also always searching for random numbers in [0,2000]
In smaller lists, the numbers are more sparse, while in larger lists the numbers are more dense.
If you have a linear data set, and are using a linear fit to look for a number in that list that may or may not be there, a denser list will have the values there more often, and the first guess is going to more often be the correct location of the search value.
That’s what is happening, and that’s why it’s showing an improvement in the linear case as the list gets larger, because it’s also getting more dense.
Here’s a graph for a version of the test where the density is kept the same for each list. The lists are between [0,5*count] and the search values are in the same range.
It’s interesting and kind of cool that both the average and min/max are flat, but this is a best case scenario for the line fit (and hybrid) search, with the data actually being linear.
Performance
Ok finally we get to performance. Many of you fine folks were probably looking at the guess count graphs and thinking “So what? Where’s the perf measurements?” TL;DR I think this is a pareto frontier advancement but i’ll explain more.
here are the perf results but don’t be too quick to say “aha!”, because they need some explanation and context. These results are on my modern-ish gaming laptop.
Results:
- Linear search takes ~1.5 nanoseconds per guess. (eg, increment the index and read the next value from the array)
- Binary search takes ~5 nanoseconds per guess.
- Both linear fit and hybrid search takes ~12 nanoseconds per guess.
So, from my tests, binary search would need to take 2.5 times as many guesses as linear fit or hybrid searching to break even. The only case where that is true in my tests is the purely linear list.
Now that I’ve said that, I don’t think the tests I’ve done are really a good apples to apples comparison.
What I did as a test was generate lists of the various types described above, generated a list of random numbers to search for in them, then had each search algorithm do all the searches and i divided the total time by the total number of guesses done to get a time per guesses for each algorithm.
It is true that the linear fit is slightly more complicated logic than a binary search, or the linear search, so computationally I do expect it to take longer, and the 2.5x as long seems like a fair measurement.
HOWEVER, searching the same list over and over is an unrealistic pattern for most applications. More of the list would be likely to be in the cache when doing multiple searches back to back like this, so memory reading would be under-reported in the profiling.
Because the linear fit (and hybrid) searches are more computationally expensive, but end up doing fewer guesses, they use more cpu, but less memory bandwidth. That means that the wins they give would show up in times when memory reads (or wherever the list was stored) were slower. Having the list in the cache is not a time when the reads are going to be slower, so I think the testing is stacked against the linear fit and hybrid testing.
That said, I can’t think of a better “canned performance test” to compare apples to apples. You really would need to drop it in, in a realistic usage case for searching in an application, and see if it was better or worse for that specific usage case.
If you were memory bandwidth bound, and thus had some compute to spare, this search seems like it could possibly be a nice option. Or, in exotic situations where reading a list was VERY VERY slow (remote servers, homomorphic encryption, data stored on disk not in memory?) this could be a better algorithm. In those exotic situations where reads are way more expensive that computation, you’d probably want to go further though, and use more advanced algorithms to really make every guess count, using a lot more CPU to do so.
Lastly on perf: none of this code has been optimized. I wrote it for clarity, not speed. It’s possible that the comparison landscape could change (either for better or worse) with optimized code.
If anyone investigates perf more deeply, I’d love to hear results and in what context those results were found. Thanks!
Quadratic Fit Search and Beyond?
An obvious questions is: can this search technique extend to quadratic and beyond?
I do think so. Let’s look at how that might work, and then i’ll point out some complications that make it more challenging.
Let’s think about the quadratic case. You’d need to start with a quadratic fit of the data, which would require 3 data samples from the list. Two data samples would be the first and last index just like the linear search, but where should the third data point be from?
One place it could be is in the middle of the list. If you can afford more processing time than that, you might consider picking whatever index gives the lowest error between the quadratic fit and the actual data stored in the array.
Now you have a quadratic fit of the data in the array and can begin searching. You have some y=f(x) function that is quadratic, and you invert it to get a x=f(y) function. All is well so far.
You make your first guess by pluggin your search value in for y and getting an x out which is your first guess for where the number is. When you read that number, if it is the search value, you are done. If it doesn’t match though, what do you do?
Your guess point is going to be between your min and max, but it might be to the left or the right of the third point you have in the quadratic fit. That is two possibilities.
Your guess may also be too low, or too high. That is two more possibilities, making for four possible outcomes to your guess.
Let’s say your guess was to the left of the “third point” and deal with these two outcomes first:
- If your guess was less than the search value, it means that your guess is the new minimum.
- If your guess was greater that the search value it means that your guess is the new maximum. A problem though is that your “third point” is now to the right of the search maximum. This isn’t so bad because it still fits real data on the curve but it seems a little weird.
If your guess was on the right of the “third point”, we have these two outcomes to deal with:
- If your guess was less than the search value, the guess is the new minimum, and the “third point” in the quadratic fit is to the left and is less than the minimum.
- If your guess was greater than the search value, the guess is the new maximum.
Are you with me so far? the “third point” seems oddly stationary at this point, but the next round of searching fixes that.
On the second step of searching (and beyond), we have some new possibilities to add to the previous four. The “third point” can either be less than the minimum or greater than the maximum. That is two possibilities.
And once again, we have two possibilities in regards to what our guess found: The guess value could be lower than the search value, or it could be higher.
Due to symmetry, let’s just consider the “third point” to be greater than our max, and then we can just consider the less than and greater than case:
- If our guess was too small, it’s the new minimum.
- If our guess was too large, it’s the new maximum, but the old maximum becomes the new “third point”. This moves the “third point” to be more local, giving us a more local quadratic fit of our data, which should help the search make better guesses.
So now, the “third point” moves around, and the quadratic fit is updated to be a localized fit, like we want it to be.
For the cubic case and above, I’ll leave that to you to sort out. It just is updating the minimum and maximums based on the guess value vs search value, and then doing a dance to make sure and keep the most local points around for the curve fit of the data, and throwing out the less local points to make room. I am pretty sure it’s extendable to any degree you want, and that one algorithm could be written to satisfy arbitrary degrees.
Now onto a complication!
Our very first step is to make an initial fit of data of whatever degree and then invert it. To invert the function, it needs to be monotonically increasing – aka there is no part on the graph where if you look at the point to the left, it’s higher. Each point on the graph should be higher than the point to the left.
The bad news is that if even looking at the quadratic case, making a quadratic curve pass through 3 data points A, B, C where A <= B <= C, the result is very often NOT going to be monotonic.
That means you are going to have a bad time trying to invert that function to make a guess for where a search value should be in the list.
I think a good plan of attack would be to fit it with a monotonic quadratic function that didn’t necessarily pass through the 3 data points. That would affect the quality of your guess, but it might (probably should??) do better at guessing than a line fit, at the cost of being more computationally expensive. I’m not sure how to do that specifically, but I’d be surprised if there wasn’t an algorithm for it.
For details on how even quadratic often isn’t monotonic:
https://twitter.com/Atrix256/status/1108031089493184512
Some possibly good leads to dealing with this:
https://en.wikipedia.org/wiki/Monotone_cubic_interpolation
Updates
Jannis Harder on mastodon says.. (https://mathstodon.xyz/@jix/109717359203055176)
Another way to combine interpolation and bisection to get the best of both is the ITP method (https://en.wikipedia.org/wiki/ITP_method) which supposedly performs very well in practice while also having good worst case guarantees. Haven’t had a use case to try it myself yet, though.
Rahul Narain says… (https://mathstodon.xyz/@narain/109720504826215482)
Looks like you are basically reinventing the false position method and its improvements, only on arrays rather than on continuous functions: https://en.wikipedia.org/wiki/Regula_falsi
Marc B. Reynolds send me a 2021 paper relevant here:
https://mastodon.gamedev.place/@mbr/115350671561297933

Closing
Thanks for reading. Hopefully you found it enjoyable.
If you use this, or do any related experimentation, I’d love to hear about it.
You used to be able to find me on twitter at https://twitter.com/Atrix256
You can now find me on mastodon at https://mastodon.gamedev.place/@demofox
