“cruel, unreasonable, or arbitrary use of power or control.” — definition of tyranny as given by google.com, emphasis is mine.
Hey All!
It appears I’ve been banned from X (twitter). I’m writing this post to show some details of this process, as well as let people know what happened instead of me just being “disappeared” quietly.
First the process of being banned.
I log in on Friday and it says I’m suspended. It tells you that you can appeal it by “proving you haven’t broken any rules” but it doesn’t tell you what you are accused of.
After maybe a day and a half I get to thinking “you know, I don’t think I should be suspended for what I said”, so I appeal, and within 30 seconds get an email that says the appeal is denied. It only then tells me what I’m accused of.
It still doesn’t tell me the punishment: is this temporary? Is it permanent? I’ve heard of people having 3 day suspensions, but 3 days have come and gone so I’m unsure if the suspension will ever be lifted. It might be lifted tomorrow, in 6 months, or never. Who knows!
Putting this in legal terms, imagine…
You get arrested. You are not told what you are arrested for, nor how long you will be imprisoned.
You are told you can write a letter to a judge explaining how you didn’t break the law.
You write this letter, and when you hand it to the guard, he already has a response in his hand that he hands back to you.
End of conversation, you sit in jail, perhaps never to see daylight again.
Getting banned from a social media platform is not the same as being jailed, but it is a good analogy to show the level of “justice” that the platform is interested in.
When made physical, it’s akin to places like Iran or China dealing with political dissidents or other undesirables. This is why we need to be careful about conflating corporate culture with American values.
It’s also worth mentioning that through a normal course of actions, I was banned from paypal many years ago because it assumed I was a fraudulent scammer for some reason that was unappealable. Elon was involved there as well. I was just doing regular things and it came out of no where.
This isn’t the first time twitter has gotten mad at me for things I’ve said. I wished ill will at several GOP politicians, including Trump, and twitter used to have the policy of “you are banned until you delete this specific post”. But, this is the first time since Elon took over.
A short time before this happened, John Carmack was asking why folks were trying to leave X and that he couldn’t understand it, could it really be spite? I wanted to post my response to his question but it’s been deleted! Most of my tweets are still there and I can see them, but this specific one criticizing Elon Musk is gone. Could this be part of the motivation for where I’m at now? Was i flagged as “kick out and don’t let back in, at the slightest hint of it being ok to do so?”
A local police department (this incident happened 30 minutes from my house, and my first game dev job is literally a street away) is shown having an altercation with a WEDDING party, in which the police start throwing punches at women, in nice dresses and high heels. One of them hits the back of her head against the ground and is knocked out.
Hitting the back of your head like that is no joke. That’s where your brain is connected to the rest of your body. My old martial arts teacher, an ex marine, called it the “dumb knot” and let us know how dangerous it was so we could train safely, and also know the implications for self defense type situations.
Seeing that pissed me off. Yes, there was some “drunken idiocy” going on, including reports that a woman tried to grab one of the officer’s guns (if they can be trusted). Assuming so, you might ask me “ok so what SHOULD they have done if not that?”. Honestly, not sure, but NOT THAT. The woman who got knocked out was essentially choke slammed to the ground to make her hit her head in a life threatening way. That was intentional – it was a guided fall straight onto the back of her head where her spine connects to her skull – and should be considered attempted murder, frankly.
What I believe specifically got me suspended though is someone made a comment that nobody got shot. My response was “yeah, those cops better watch out next time for a good guy with a gun”. Playing off the arguments about how the solution to gun violence is more armed people, and also that we are pretty powerless when police go beast mode like this, just acting completely out of line. How many videos have we seen of police violently beating people in handcuffs who never resisted? Especially protestors. Or reporters and MEDICS at protests. This bullshit has to stop.
What happened to you being the champion of free speech Elon? The truth is, you only want the speech you agree with to be free, and that makes you a dangerous idiot.
People considering going to mars with this guy, go watch Total Recall with Arnold Schwarzenegger to get an idea of what that would be like.
Anyhow, catch me on mastodon and blue sky assuming this suspension is permanent (It’s the halting problem, so no idea). It’s you, my connections and our awesome community that I value most, so if it ends up not being permanent, see you on x til it sinks or is under significantly different management – hopefully soon!
Also, someone make sure John Carmack sees this, as a better answer to his post I linked above 🙂
That algorithm needed to generate multiple Hamiltonian cycles which didn’t use any graph edges already used by other cycles, and I didn’t like that it did this by generating cycles randomly until it found one that is valid. The “randomly generate candidates until success” meant an erratic runtime that might not even find a solution in a reasonable amount of time.
This post shows a way to generate those cycles in a straightforward way and compares the resulting cycles to the algorithm in the previous post. The algorithm requires a prime number count of nodes, but if you don’t have a prime number count of nodes, you can pad the graph with extra nodes to make it reach the next prime number. If the cycles are for voting, you can make those padding nodes automatically lose to real nodes, without needing to do an actual vote. This algorithm also works with non prime number amounts of nodes if you relax what “works” means a bit; instead of making cycles, it will sometimes make isolated loops, but we talk about how that can still be useful.
The code that goes with this post lives at https://github.com/Atrix256/PairwiseVoting. The visual “star” diagrams were made with drawgraphs.py. The csv files for the graphs were made by main.cpp.
The Algorithm
The algorithm is pretty straightforward.
If you have N nodes and N is a prime number, you loop from 0 to N-1. nodeA is the loop index. nodeB is (nodeA + 1) % N. This is the first cycle.
For the second cycle, you loop again. nodeA is the loop index. nodeB is (nodeA + 2) % N.
For the third cycle, you loop again. nodeA is the loop index. nodeB is (nodeA + 3) % N.
To get all cycles, you repeat this, for each integer from 1 to N/2, but not including N/2.
Let’s see an example.
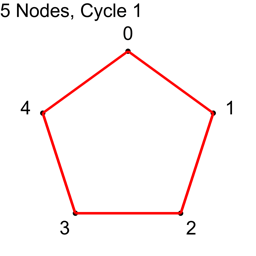
Example 1 – Five Nodes
For the first cycle, we use each node index 0,1,2,3,4 as nodeA, and add 1 to each, modulo 5, to get nodeB.
Node A
Node B
Connection
0
1
0 – 1
1
2
1 – 2
2
3
2 – 3
3
4
3 – 4
4
0
4 – 0
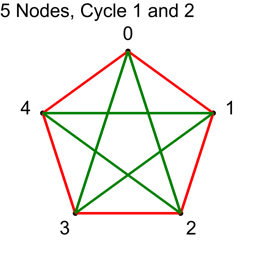
We next add 2:
Node A
Node B
Connection
0
2
0 – 2
1
3
1 – 3
2
4
2 – 4
3
0
3 – 0
4
1
4 – 1
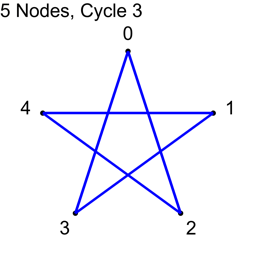
N/2 is 2.5, so we should stop at this point. Let’s see what happens if we do 3 anyways.
Node A
node B
Connection
0
3
0 – 3
1
4
1 – 4
2
0
2 – 0
3
1
3 – 1
4
2
4 – 2
We got the same connections when we added 3, as when adding 2. We’ll see why shortly.
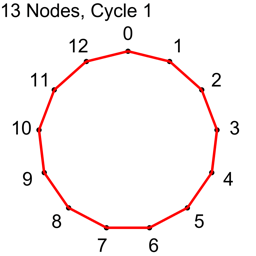
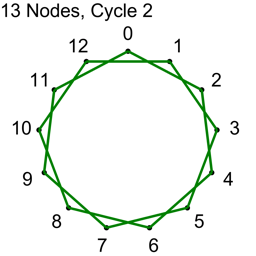
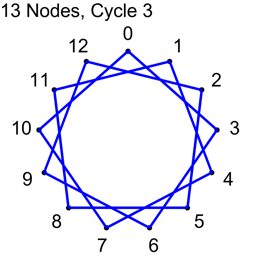
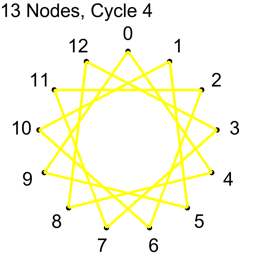
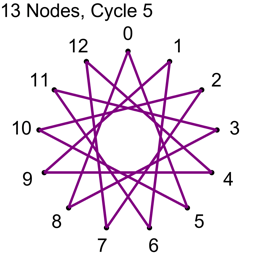
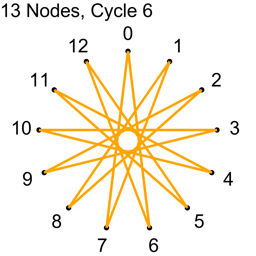
Example 2 – Thirteen Nodes
Just the diagrams, one cycle at a time, because otherwise it’s too messy.
Why Does This Work?
For the first cycle, we start with every node we have as nodeA, then add 1 and modulo by N to get each nodeB. That gives us N connections, and they are all unique. We have used up all the connections where the nodes are 1 index apart and no other cycle is going to make a connection with nodes that are 1 index apart. We know that this is a cycle and that we can get from any node to any other node because you can subtract 1 or add 1 repeatedly to get from any index to any other index.
For the second cycle, we do the same but add 2 and modulo by N to get nodeB. We again have N connections and they are all unique. We also have used up all the connections where the nodes are 2 indices apart and no other cycle is going to make any connection where the nodes are 2 indices apart.
For the second cycle, we can also get from any node to any other node in this cycle, but it’s less obvious why. When working with the integers modulo N, you have something called a ring, which is a type of group. If you start at any number on the ring, and repeatedly add some number M which is relatively prime to N (no common factors other than 1), you will visit all numbers 0 to N-1, and will visit them all once before repeating any. When N is a prime number, then EVERY number less than N is relatively prime to N.
You can try this yourself:
Pick some prime number N
Pick any number M between 1 and N-1.
Starting at zero (or any other value), add M, modulo by N, and write out the value.
Repeat step 3 and you’ll see that you’ll visit all N numbers and after N steps you will get back to where you started.
Let’s do this with N=7 and M=2:
Step
Value
Next Value
1
0
(0 + 2) % 7 = 2
2
2
(2 + 2) % 7 = 4
3
4
(4 + 2) % 7 = 6
4
6
(6 + 2) % 7 = 1
5
1
(1 + 2) % 7 = 3
6
3
(3 + 2) % 7 = 5
7
5
(5 + 2) % 7 = 0
8
0
(0 + 2) % 7 = 2
So, when N is prime, every time we add a specific value greater than 0 and less than N to all the node indices, we’ll get a cycle that uses edges that no other cycle will give us.
Why Start Cycles at 1 and Stop at N/2?
There are two explanations for why this is. One is a mathematical explanation and the other is a brick wall. Let’s look at the brick wall first, then talk about the mathematical reason.
If you have N nodes in a graph, the total number of connections you can make between nodes is N * (N-1) / 2. Tangent: if you think that looks like Gauss’ formula, you are correct! It’s Gauss’ formula for N-1.
Returning to example 1, that had 5 nodes which means there are 5*4/2 = 10 total connections.
Each Hamiltonian cycle on that graph takes 5 connections away from all possible connections, and with 10 connections total, that means there can only be 2 cycles.
5/2 is 2.5, so we do cycle 1, then cycle 2, and stop before we do cycle 3.
We literally cannot do more than 2 cycles when there are 5 nodes.
Looking at example 2, there are 13 nodes, which means there are 78 total connections.
Each cycle takes 13 connections, so all connections are used up after 6 cycles.
13/2 is 6.5, so we know to stop at 6 before going to 7.
The brick wall limitation is that after N/2 cycles, we have no more edges to make cycles out of!
The mathematical explanation involves rings. To quote the previous section: When working with the integers modulo N, you have something called a ring, which is a type of group.
In rings, there is an interesting connection between the numbers less than N/2 and the numbers greater than N/2. Adding a number greater than N/2 is the same as subtracting a number less than N/2. As an example, let’s look at N=7 in the table below. We can see that adding 5 is the same as subtracting 2.
Starting Value
(Starting Value + 5) % 7
(Starting Value – 2) % 7
0
5
5
1
6
6
2
0
0
3
1
1
4
2
2
5
3
3
6
4
4
This means that if we have a connection where nodeB = (nodeA + 5) % 7, it is exactly the same as the connection where nodeA = (nodeB + 2) % 7. More plainly, cycle 5 will make the same connections as cycle 2. The nodeA and nodeB values will be swapped, but it will be the same connections.
Cycle N/2 is the point where positive numbers become the same as smaller negative numbers, so that is where we stop. Since all prime numbers (greater than 2) are odd, N/2 will never be an integer, so we don’t have to think about what to do at exactly N/2.
What if N isn’t Prime?
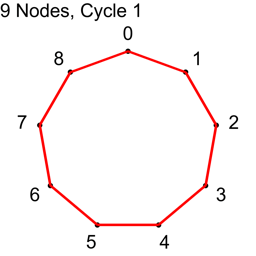
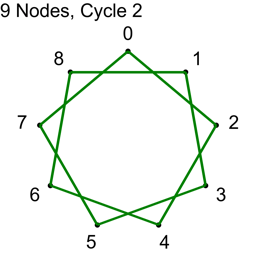
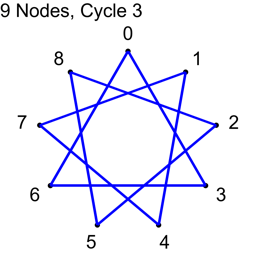
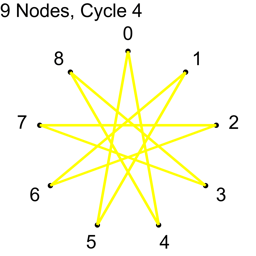
If N isn’t prime, not all “cycles” will be cycles. The algorithm will visit all nodes, but there will not be a path from each node to every other node. Here are the cycles for where N=9.
With N=9, only cycles 1,2 and 4 make cycles. Cycle 3 makes three loops: 0,3,6 and 1,4,7 and 2,5,8. If you wanted to use this algorithm to make connections in a graph for voting or for a tournament, you could still do so, but the first cycle you do should be a coprime (cycle 1 is an easy one to choose as the first cycle), so that the graph was connected from the beginning, and these loops would increase connectivity of the graph, without having to be fully fledged Hamiltonian cycles.
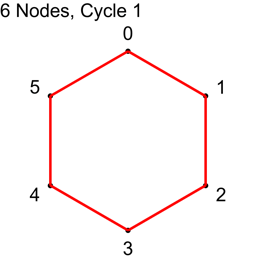
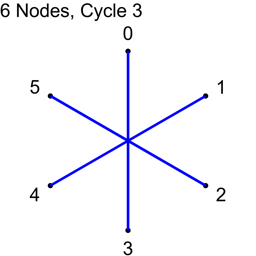
Allowing N not to be prime also allows an even numbered N. In that case, when you create cycles from 1 to N/2, should you include N/2 or not? Let’s see what happens when N=6, for cycles 1,2 and 3.
What happened to cycle 3?
Cycle 3 made all the connections where the difference between the node indices was 3, and it made 6 connections. Unfortunately, there are only 3 unique connections where the difference in node indices is 3: 0-3, 1-4, 2-5. Cycle 3 added the following redundant connections: 3-0, 4-1, 5-2. The answer about whether you should include N/2 if using a non prime number of nodes is ultimately up to you, but you should know that when you do so, you’ll get redundant connections. On the flip side, if you don’t include them, those are node connections that you will never be able to make otherwise, using this algorithm. You’ll have to decide which way you want to go. You could always pad with another node to make it odd, and dodge this issue 🙂
Is This Random Enough?
When you see that the first cycle gives you the connections in order 0 – 1, 1 – 2, 2 – 3, etc. you may wonder if this method is making random enough cycles.
In defense of this seeming lack of randomness, keep in mind that node indices are just arbitrary names of nodes. Two nodes that have an index difference of 1 are not any more, or less, similar than two other nodes that have an index difference of 5. The numbers are just arbitrary labels.
However, the lack of randomness does come up on subsequent cycles. Think of the path from node A to node B on graphs made this way as a simplified path finding problem. After you’ve done 1 cycle, you know you can take steps of size 1 from any node to any other node. After you’ve done 2 cycles, you know you can take steps of size 2. After 3 cycles you can take steps of size 3 and so on. Using this knowledge, you can craft a path from A to B using the largest steps to get as close as possible, then a smaller step as a remainder. This is nice and orderly, but when graph edges are taken at random, there will be shortcuts sprinkled throughout the graph. Like if in the first cycle of a 1000 node graph, if there is a link from node 0 to node 500, that will drastically reduce the length of the path between the most distant nodes.
So on one hand, the lack of randomness doesn’t matter, but on another hand, it does.
There are some ways to inject randomness into this algorithm if you want to though. One easy thing you can do is shuffle the nodes before running this algorithm. Another thing you can do is perform the cycles in a random order. If you have 1009 nodes, that gives you 1009/2=504 cycles. The last post showed that you only need a handful of cycles to get a good result if using cycles for voting or tournaments. Instead of doing cycles 1, 2, and 3, you could randomize the order and do it an order like 100, 4, 235. These points of randomization could help make up for lack of randomization in the cycles themselves, and are also helpful if you ever need multiple sets of non overlapping Hamiltonian cycles. That allows this algorithm to take in a “random seed” to get different results for different seeds, while remaining deterministic.
Results In Graph Quality Tests
To understand the quality of these Hamiltonian cycles, I plugged them into the voting algorithm from the last blog post. I put in a version that does cycles in order (1, 2, 3 and so on), and also put in a version that does the cycles in a random order, but makes sure the first cycle is always 1, to ensure the graph is connected, in case the number of nodes is not prime.
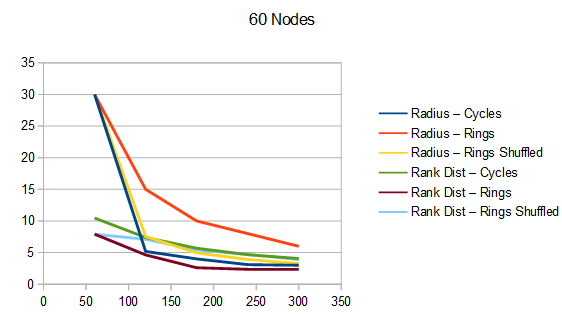
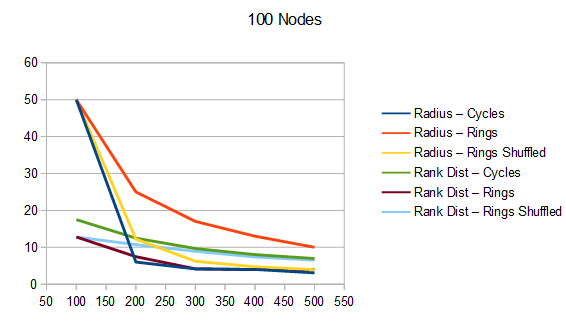
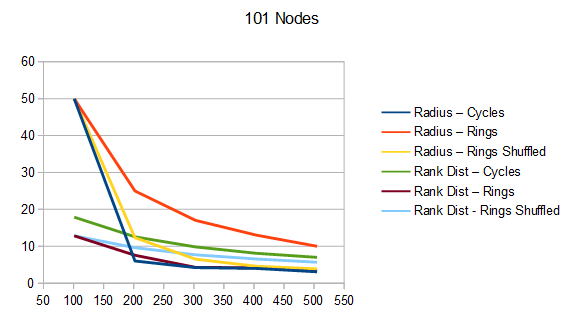
The graphs below are the average of 100 tests. The source code generates csv files with more information, including standard deviation.
For radius, cycles are randomly generated and rings shuffled are shuffled differently each run. The non shuffled rings are the same each test. For rank distance, the actual score value of each node changes each test, so all rank distance graphs are subject to randomization in each test. This can also be seen as shuffling the nodes before running the algorithm, which is sometime I talked about in the last section.
For both radius and rank distance, a lower score is better.
It looks like random cycles (the technique from the last post) decreases the radius the most. That is not surprising, since that is based on solid mathematics to reduce the radius quickly. Using the deterministic cycles in this post, but shuffling the order the cycles looks to be a pretty good method for reducing radius too. It isn’t as good as random cycles, but it can quickly and easily find as many non overlapping Hamiltonian cycles as you want, up to the full limit of how many cycles are possible. Randomly generating cycles until they are valid gets very slow for high cycle counts and high node counts.
These graphs tell a different story for the rank distance. These show that the NON SHUFFLED ordering of deterministic cycles do the best for making the most accurate ranked list. I’m a bit surprised, as this shows that decreasing radius may be a good idea for improving the ranked list quality, but it isn’t the whole story for making the highest quality ranked list approximation.
Perhaps this has something to do with radius being measured as the worst outlier, while the rank distance is calculated as an average quality of all nodes.
Quick recap on rank distance: The rank distance is calculated by using the voting algorithm from last post to make a ranked list, and then summing up the difference of each node’s placement in that estimated ranking list, versus the nodes placement in the actual ranking list. It’s the optimal transport cost to change the estimated ranking list into the actual ranking list. That value is divided by the number of nodes to try and normalize it.
In the Summer of Math Exposition, people make online math content, and prizes are given to the winners. The challenge is there are thousands of entrants, where a typical entry may be a 30 minute video of nontrivial mathematics. How could all those entries be judged to find the best ones?
The video I linked before talks about how to approach this with graph theory and makes use of a lot of really interesting math, including eigenvectors of adjacency matrices. The result is that they have volunteer judges do a relatively small number of votes between pairs of videos, and from that, the winners emerge in a way that is strongly supported by solid mathematics.
I recommend giving that video a watch, but while the motivation of the technique is fairly complicated, the technique itself ends up being very simple to implement.
I’ll give some simplified background to the algorithm, then talk about how to implement it, and finally show some results.
Background
Let’s assume there are N players in a tournament, where there is an absolute ordering of the players. This is in contrast to rock, paper, scissors, where there is no 1st place, 2nd place, and 3rd place for those three things. We are going to assume that there are no cycles, and the players can actually be ordered from best to worst.
A way to find the ordering of the N players could be to take every possible pair of players A and B and have them play against each other. If we did this, we’d have a fully connected graph of N nodes, and could use an algorithm such as Page Rank (https://en.wikipedia.org/wiki/PageRank) to turn the results of that into an ordered list.
If there are N players, we can use Gauss’ Formula (https://blog.demofox.org/2023/08/21/inverting-gauss-formula/) to calculate that there are N * (N-1) / 2 matches that would need to be played. For 1000 players, that means 499,500 matches. Or in the case of SoME3 videos, that is 499,500 times a volunteer judge declares which is better between two 30 minute math videos. That is a lot of video watching!
Tom Scott has an interesting video about this way of voting: https://www.youtube.com/watch?v=ALy6e7GbDRQ. In that situation, it was just an A/B vote between concepts like “bees” and “candy”, so was a lot quicker to make pairwise votes.
Wouldn’t it be nicer if we could do a smaller number of votes/matches, and do a sparse number of the total votes, while still getting an as accurate result as possible?
The SoME3 video explains how to do this and why the method works.
One thing the video talks about is the concept of a “radius of a graph”.
If you have a node A and a node B, the shortest path on the graph between those nodes is the distance. If you calculate that distance for all nodes, the largest value you get is the radius of the graph.
It’s also important that there is a path between every node to every other node! This is known as the graph being “connected”. If the graph isn’t connected, the radius is undefined since the largest distance will be infinite (no path between 2 nodes). If the radius is 1, such that there is a connection between each node to every other node, then the graph is called a complete graph.
The video talks about how it is important to make the radius smaller for a higher quality result of the voting. The larger the distance between two nodes, the less direct the comparison is between those two nodes which makes their ordering less certain. The shorter the distance, the more direct the comparison is, which makes their ordering more certain. Reducing the graph radius ensures that all distances are smaller or equal to that radius in distance.
You can imagine that if you were to pick pairs to vote on at random, that it probably isn’t going to be the optimal voting pairs to give the smallest radius of a graph. For instance, due to the nature of uniform random numbers, you might have 20 votes between node 5 and other nodes, while you only have 2 votes between node 4 and other nodes. A node picked at random is more likely to have a shorter path to node 5 than it is to node 4, and so node 4 is going to be the longer distance that defines the overall radius of the graph. If the votes were more evenly spread to all the nodes, the maximum distance (aka radius) would go down more.
The Algorithm
The algorithm ends up being super simple:
Visit all nodes in a random order. This is a random cycle or a random Hamiltonian cycle.
Each connection between nodes in that cycle are votes to be done or matches to be played. So for N nodes, there are N votes. Note that each node is involved in 2 votes, but it’s still only N votes!
That is one iteration. Goto 1 again, but when generating a random cycle, make sure it doesn’t contain any edges (votes) already done in a previous iteration. Repeat until you are satisfied.
A simple way to implement visiting all nodes in a random order is to just shuffle a list of integers that go from 0 to N-1.
The magic is that each iteration decreases the radius exponentially.
So, it’s very simple and effective.
Alternate Algorithm
I spent some time thinking about this algorithm and trying to come up with alternatives.
One thing that bothered me was generating random cycles, but making sure no edges in the cycle were already used. That loop may take a very long time to execute. Wouldn’t it be great if there was some O(1) constant time algorithm to get at least a pseudorandom cycle that only contained edges that weren’t visited yet? Maybe something with format preserving encryption to do constant time shuffling of non overlapping cycles?
Unfortunately, I couldn’t think of a way.
Another thought I had was that it would be nice if there was some way to make a “low discrepancy sequence” that would give a sequence of edges to visit to give the lowest radius, or nearly lowest radius for the number of edges already visited.
I also couldn’t think of a way to do that.
For that second idea, I think you could probably brute force calculate a list like that in advance for a specific number of nodes. Once you did it for 10 node graphs, you’d always have the list.
I didn’t pursue that, but it might be interesting to try some day. I would use the radius as the measurement to see which edge would be best to add next. Before the graph is connected, with a path from every node to every other node, the radius is undefined, but that is easily solved by just having the first N edges be from node i to i+1 to make the graph connected.
In the end, I came up with an algorithm that isn’t great but has some nice properties, like no looping on random outcomes.
The first iteration makes N connections, connecting each node i to node i+1. This isn’t randomized, but you could shuffle the nodes before this process if you wanted randomized results after this first iteration.
Each subsequent iteration makes N new connections. It chooses those N connections (graph edges) randomly, by visiting all N*(N-1)/2 edges in a shuffled, random order. It uses format preserving encryption to make a shuffle iterator with random access, instead of actually shuffling any lists. It knows to ignore any connection between nodes that are one index apart, since that is already done in step 1.
The end result is that the algorithm essentially makes a simple loop for the first iteration, and then picks N random graph edges to connect in each other iteration.
An important distinction between my algorithm and the original is that after the first iteration, the links chosen don’t form a cycle. They are just random links, so may involve some nodes more often and others less often, making for uneven node distances, and larger graph radius values.
Because of this, you could call the SoME3 algorithm a “random cycles” algorithm, and mine a “random edges” algorithm.
Once You Have the Graph…
Whichever algorithm you use makes you end up with a connected graph where the edges between vertices represent votes that need to be done (or matches that need to be played).
When you do those matches, you make the connections be directed instead of undirected. You make the loser point to the winner.
You can then do the page rank algorithm, which makes it so rank flows from losers to winners through those connections to get a final score for each node. You can sort these final scores to get a ranking of nodes (players, videos, whatever) that is an approximation of the real ranking of the nodes.
In the code that goes with this post, I gave each node a “random” score (hashing the node id) and that score was used to determine the winner in each edge, by comparing this score between the 2 nodes involved to find which one won.
Since each node has an actual score, I was able to make an actual ranking list to compare to the approximated one.
We now need a way to compare how close the approximated ranking list is, compared to the actual ranking list. This tells us how good our approximation is.
I divided this sum by the number of nodes to normalize it a bit, but graphs of different sizes still had slightly different scale scores.
Results
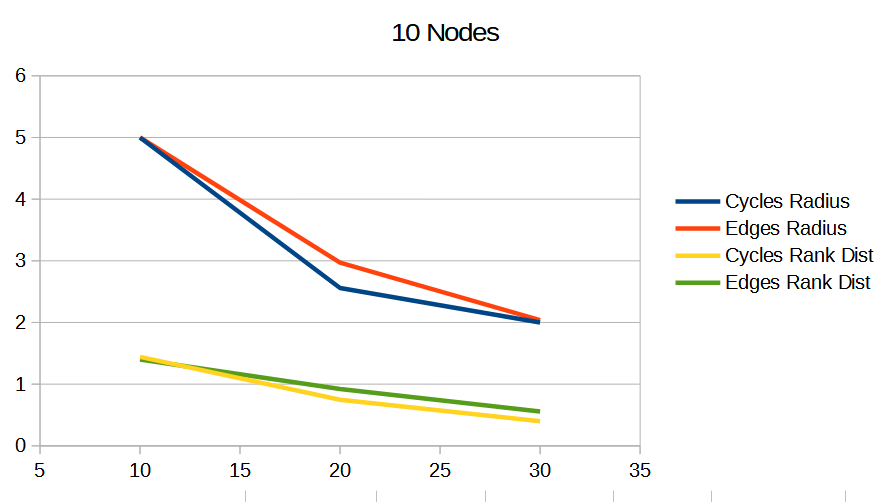
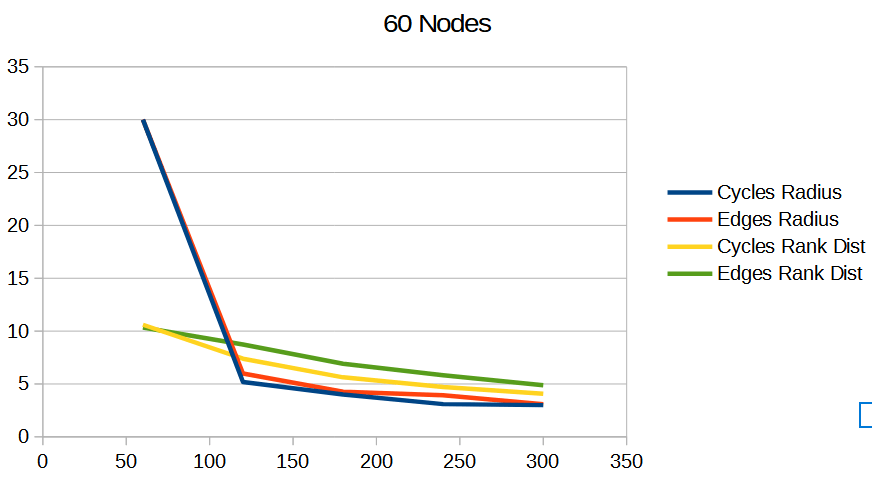
Below are some graphs comparing the random cycles algorithm (“Cycles”) to the random edges algorithm (“Edges”). The radius is the radius of the graph, and lower is better. The rank dist says how accurate the approximated rank was, and lower is better.
The graphs show that the random cycles algorithm does better than the random edges algorithm, both in radius, as well as accuracy of the approximated ranking.
Frankly, each iteration being a random hamiltonian cycle on a graph has a certain “low discrepancy” feel to it, compared to random edge selection which feels a lot more like uniform random sampling. By choosing a random cycle, you are making sure that each node participates in 2 votes or matches each iteration. With random edge selection, you are making no such guarantee for fairness, and that shows up as worse results.
To me, that fairness / “low discrepancy” property is what makes choosing random cycles the superior method.
In the graphs below, the x axis is the number of votes done. Each data point is at an iteration. The graphs show the average of 100 tests.
What About Tournament Brackets?
Tournament brackets are another way of finding a winner by having pairwise votes or matches.
If you have 8 players, you pair them up and play 4 matches to get 4 winners. You then pair them up to get 2 matches and 2 winners. Lastly you play the last match to get the winner. That is 4+2+1=7 matches for players.
If you have 16 players, you first do 8 matches, then 4 matches, then 2 matches, then 1 match. That is 8+4+2+1=15 matches for 16 players.
In general, If you have N items, it only takes N-1 votes or matches to get a winner – and assuming matches have no random chance in them, gives you the EXACT winner. In the SoME3 algorithm, each iteration takes N votes or matches, and there are multiple iterations, so seems to take a lot more votes or matches.
That is true, and tournament brackets are very efficient at finding the winner by doing pairwise comparisons.
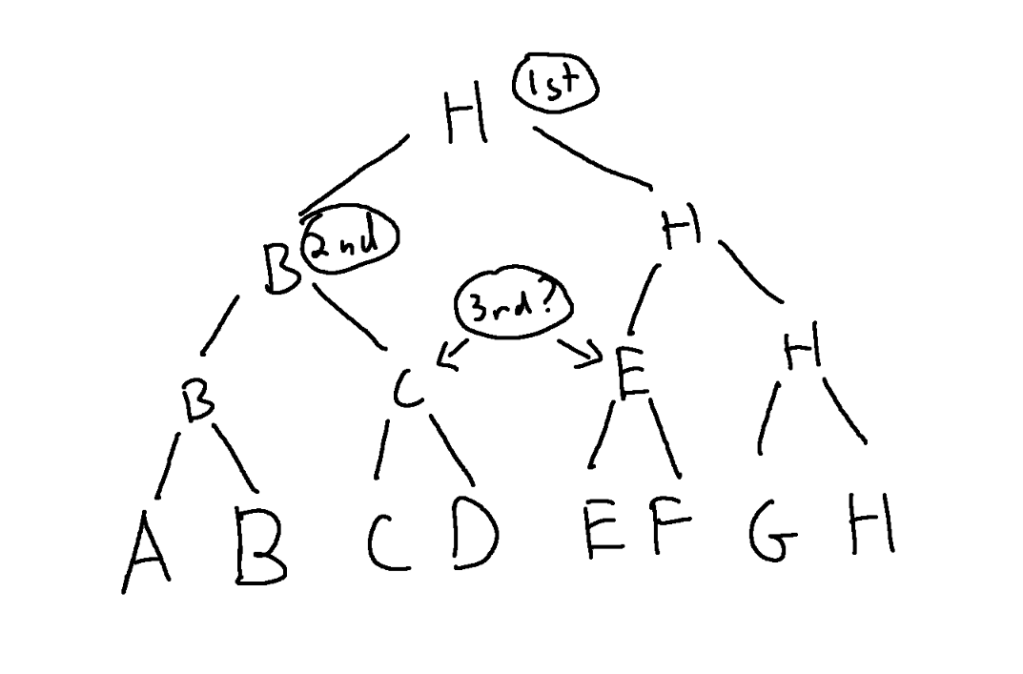
Tournament brackets can only tell you who is first and who is second though. They can’t tell you who is third. They can tell you who made it to the finals or semi finals etc, but the people who made it to those levels have no ordering within the levels.
Figure 1. H is first and B is second but who is 3rd?? C or E, but it’s ambiguous which. Who is 4th, 5th, 6th, 7th and 8th?
Another factor to consider is that who plays in a tournament match depends on who won the previous matches. This makes it so later matches are blocked from happening until earlier matches have happened.
If these things aren’t a problem for your situation, a tournament bracket is pretty efficient with matches and votes! Otherwise, you might reach for the SoME3 algorithm 🙂
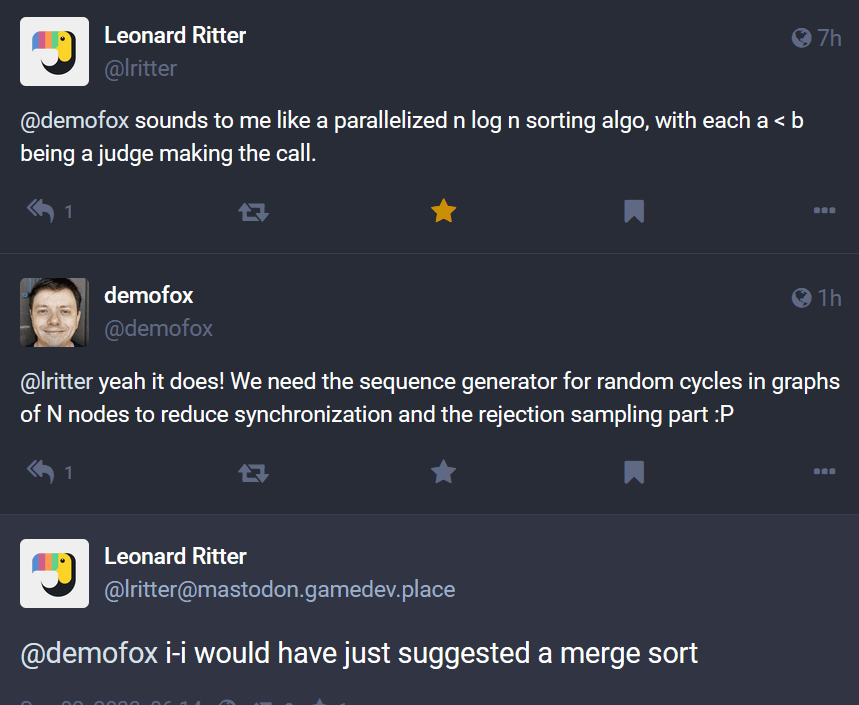
So interestingly, merge sort is a lot like tournament brackets, where the earlier matches define who plays in the later matches. However, the number of matches played in total can vary!
Lets say you had two groups of four players, where in each group, you knew who was best, 2nd best, 3rd best and last. And say you wanted to merge these two groups into one group of eight, knowing who was best, 2nd best, etc all the way to last.
The merge operation of merge sort (https://www.youtube.com/watch?v=4VqmGXwpLqc) would do between 4 and 7 comparisons here to get that merged list, which is between 4 and 7 matches or votes for us. If you then wanted to merge two groups of 8, it would do between 8 and 15 comparisons.
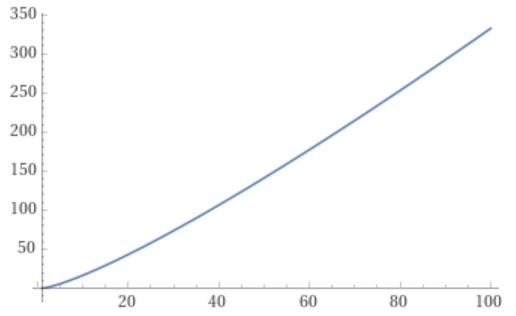
In general, if you have N items, the fewest number of comparisons merge sort will do is N/2 * log2(N). This is each merge will at minimum do N comparisons, and there are log2(N) levels of merging.
The graph for that is pretty linear which is nice. No large growth of comparisons as the number of items or nodes grow. This is what makes merge sort a decent sorting algorithm.
Ultimately, this connection shows that the SoME3 voting algorithm can also be seen as an approximate sorting algorithm, which is neat.