The images below were path traced using 100,000 samples per pixel, using the sample code provided in this post.

Path tracing is a specific type of ray tracing that aims to make photo realistic images by solving something called the rendering equation. Path tracing relies heavily on a method called Monte Carlo integration to get an approximate solution. In fact, it’s often called “Monte Carlo Path Tracing”, but I’ll refer to it as just “Path Tracing”.
In solving the rendering equation, path tracing automatically gets many graphical “features” which are cutting edge research topics of real time graphics, such as soft shadows, global illumination, color bleeding and ambient occlusion.
Unfortunately, path tracing can take a very long time to render – like minutes, hours, or days even, depending on scene complexity, image quality desired and specific algorithms used. Despite that, learning path tracing can still be very useful for people doing real time rendering, as it can give you a “ground truth” to compare your real time approximating algorithms to, and can also help you understand the underlying physical processes involved, to help you make better real time approximations. Sometimes even, data is created offline using path tracing, and is “baked out” so that it can be a quick and simple lookup during runtime.

There is a lot of really good information out there about path tracing, walking you through the rendering equations, monte carlo integration, and the dozen or so relevant statistical topics required to do monte carlo integration.
While understanding that stuff is important if you really want to get the most out of path tracing, this series of blog posts is meant to be more informal, explaining more what to do, and less deeply about why to do it.
When and if you are looking for resources that go deeper into the why, I highly recommend starting with these!
- http://graphicscodex.com/ – Online book, not free but well worth the 10$. I never thought I would understand the render equation until I read this.
- Physically Based Rendering – From Theory To Implementation – A physical book that is very good.
- Scratchpixel 2.0 – Global Illumination and Path Tracing – A free online resource.
- smallpt is a path tracer written in 99 lines of code. Go check it out!
Source Code
You can find the source code that goes along with this post here:
Github: Atrix256/RandomCode/PTBlogPost1/
You can also download a zip of the source code here:
The Rendering Equation
The rendering equation might look a bit scary at first but stay with me, it is actually a lot simpler than it looks.

Here’s a simplified version:

In other words, the light you see when looking at an object is made up of how much it glows in your direction (like how a lightbulb or a hot coal in a fireplace glows), and also how much light is reflected in your direction, from light that is hitting that point on the object from all other directions.
It’s pretty easy to know how much an object is glowing in a particular direction. In the sample code, I just let a surface specify how much it glows (an emissive color) and use that for the object’s glow at any point on the surface, at any viewing angle.
The rest of the equation is where it gets harder. The rest of the equation is this:

The integral (the 

One of the reasons things get harder at this point is that there are an infinite number of points on the hemisphere.
Let’s ignore the integral for a second and talk about the rest of the equation. In other words, lets consider only one of the points on the hemisphere for now.
– This is the “Bidirectional reflectance distribution function”, otherwise known as the BRDF. It describes how much light is reflected towards the view direction, of the light coming in from the point on the hemisphere we are considering.
– This is how much light is coming in from the point on the hemisphere we are considering.
– This is the cosine of the angle between the point on the hemisphere we are considering and the surface normal, gotten via a dot product. What this term means is that as the light direction gets more perpendicular to the normal, light is reflected less and less. This is based on the actual behavior of light and you can read more about it here if you want to: Wikipedia: Lambert’s Cosine Law. Here is another great link about it lambertian.pdf. (Thanks for the link Jay!)
So what this means is that for a specific point on the hemisphere, we find out how much light is coming in from that direction, multiply it by how much the BRDF says light should be reflected towards the view direction from that direction, and then apply Lambert’s cosine law to make light dimmer as the light direction gets more perpendicular with the surface normal (more parallel with the surface).
Hopefully that makes enough sense.
Bringing the integral back into the mix, we have to sum up the results of that process for each of the infinite points on the hemisphere, multiplying each value by the fractional size of the point’s area for the hemisphere. When we’ve done that, we have our answer, and have our final pixel color.
This is where Monte Carlo integration comes in. Since we can’t really sum the infinite points, multiplied by their area (which is infinitely small), we are instead going to take a lot of random samples of the hemisphere and average them together. The more samples we take, the closer we get to the actual correct value. Not too hard right?
Now that we have the problem of the infinite points on the hemisphere solved, we actually have a second infinity to deal with.
The light incoming from a specific direction (a point on the hemisphere) is just the amount of light leaving a different object from that direction. So, to find out how much light is coming in from that direction, you have to find what object is in that direction, and calculate how much light is leaving that direction for that object. The problem is, the amount of light leaving that direction for that object is in fact calculated using the rendering equation, so it in turn is based on light leaving a different object and so on. It continues like this, possibly infinitely, and even possibly in loops, where light bounces between objects over and over (like putting two mirrors facing eachother). We have possibly infinite recursion!
The way this is dealt with in path tracers is to just limit the maximum amount of bounces that are considered. Higher numbers of bounces gives diminishing returns in general, so usually it’s just the first couple of bounces that really make a difference. For instance, the images at the top of this post were made using 5 bounces.
The Algorithm
Now that we know how the rendering equation works, and what we need to do to solve it, let’s write up the algorithm that we perform for each pixel on the screen.
- First, we calculate the camera ray for the pixel.
- If the camera ray doesn’t hit an object, the pixel is black.
- If the camera ray does hit an object, the pixel’s color is determined by how much light that object is emitting and reflecting down the camera ray.
- To figure out how much light that is, we choose a random direction in the hemisphere of that object’s normal and recurse.
- At each stage of the recursion, we return: EmittedLight + 2 * RecursiveLight * Dot(Normal, RandomHemisphereAngle) * SurfaceDiffuseColor.
- If we ever reach the maximum number of bounces, we return black for the RecursiveLight value.
We do the above multiple times per pixel and average the results together. The more times we do the process (the more samples we have), the closer the result gets to the correct answer.
By the way, the multiplication by 2 in step five is a byproduct of some math that comes out of integrating the BRDF. Check the links i mentioned at the top of the post for more info, or you can at least verify that I’m not making it up by seeing that wikipedia says the same thing. There is also some nice psuedo code there! (:
Wikipedia: Path Tracing: Algorithm
Calculating Camera Rays
There are many ways to calculate camera rays, but here’s the method I used.
In this post we are going to path trace using a pin hole camera. In a future post we’ll switch to using a lens to get interesting lens effects like depth of field.
To generate rays for our pin hole camera, we’ll need an eye position, a target position that the eye is looking at, and an imaginary grid of pixels between the eye and the target.
This imaginary grid of pixels is what is going to be displayed on the screen, and may be thought of as the “near plane”. If anything gets between the eye and the near plane it won’t be visible.
To calculate a ray for a pixel, we get the direction from the eye to the pixel’s location on the grid and normalize that. That gives us the ray’s direction. The ray’s starting position is just the pixel’s location on that imaginary grid.

I’ll explain how to do this below, but keep in mind that the example code also does this process, in case reading the code is easier than reading a description of the math used.
First we need to figure out the orientation of the camera:
- Calculate the camera’s forward direction by normalizing (Target – Eye).
- To calculate the camera’s right vector, cross product the forward vector with (0,1,0).
- To calculate the camera’s up vector, cross product the forward vector with the right vector.
Note that the above assumes that there is no roll (z axis rotation) on the camera, and that it isn’t looking directly up.
Next we need to figure out the size of our near plane on the camera’s x and y axis. To calculate this, we have to define both a near plane distance (I use 0.1 in the sample code) as well as a horizontal and vertical field of view (I use a FOV of 40 degrees both horizontally and vertically, and make a square image, in the sample code).
You can get the size of the window on each axis then like this:
- WindowRight = tangent(HorizontalFOV / 2) * NearDistance
- WindowTop = tangent(VerticalFOV / 2) * NearDistance
Note that we divide the field of view by 2 on each axis because we are going to treat the center of the near plane as (0,0). This centers the near plane on the camera.
Next we need to figure out where our pixel’s location is in world space, when it is at pixel location (x,y):
- Starting at the camera’s position, move along the camera’s forward vector by whatever your near plane distance is (I use a value of 0.1). This gets us to the center of the imaginary pixel grid.
- Next we need to figure out what percentage on the X and Y axis our pixel is. This will tell us what percentage on the near plane it will be. We divide x by ScreenWidth and y by ScreenHeight. We then put these percentages in a [-1,1] space by multiplying the percentages by 2 and subtracting 1. We will call these values u and v, which equate to the x and y axis of the screen.
- Starting at the center of the pixel grid that we found, we are going to move along the camera’s right vector a distance of u and the camera’s up vector a distance of v.
We now have our pixel’s location in the world.
Lastly, this is how we calculate the ray’s position and direction:
- RayDir = normalize(PixelWorld – Eye)
- RayStart = PixelWorld
We now have a ray for our pixel and can start solving eg ray vs triangle equations to see what objects in the scene our ray intersects with.
That’s basically all there is to path tracing at a high level. Next up I want to talk about some practical details of path tracing.
Rendering Parameters, Rendering Quality and Rendering Time
A relevant quote from @CasualEffects:

Below are a few scenes rendered at various samples per pixel (spp) and their corresponding rendering times. They are rendered at 128×128 with 5 bounces. I used 8 threads to utilize my 8 cpu cores. Exact machine specs aren’t really important here, I just want to show how sample count affects render quality and render times in a general way.


There’s a couple things worth noting.
First, render time grows roughly linearly with the number of samples per pixel. This lets you have a pretty good estimate how long a render will take then, if you know how long it took to render 1000 samples per pixel, and now you want to make a 100,000 samples per pixel image – it will take roughly 100 times as long!
Combine that with the fact that you need 4 times as many samples to half the amount of error (noise) in an image and you can start to see why monte carlo path tracing takes so long to render nice looking images.
This also applies to the size of your render. The above were rendered at 128×128. If we instead rendered them at 256×256, the render times would actually be four times as long! This is because our image would have four times as many pixels, which means we’d be taking four times as many samples (at the same number of samples per pixel) to make an image of the same quality at the higher resolution.
You can affect rendering times by adjusting the maximum number of bounces allowed in your path tracer as well, but that is not as straightforward of a relationship to rendering time. The rendering time for a given number of bounces depends on the complexity and geometry of the scene, so is very scene dependent. One thing you can count on though is that decreasing the maximum number of bounces will give you the same or faster rendering times, while increasing the maximum number of bounces will give you the same or slower rendering times.
Something else that’s really important to note is that the first scene takes a lot more samples to start looking reasonable than the second scene does. This is because there is only one small light source in the first image but there is a lot of ambient light from a blue sky in the second image. What this means is that in the first scene, many rays will hit darkness, and only a few will hit light. In the second scene, many rays will hit either the small orb of light, or will hit the blue sky, but all rays will hit a light source.
The third scene also takes a lot more samples to start looking reasonable compared to the fourth scene. This is because in the third scene, there is a smaller, brighter light in the middle of the ceiling, while in the fourth scene there is a dimmer but larger light that covers the entire ceiling. Again, in the third scene, rays are less likely to hit a light source than in the fourth scene.
Why do these scenes converge at different rates?
Well it turns out that the more difference there is in the things your rays are likely to hit (this difference is called variance, and is the source of the “noisy look” in your path tracing), the longer it takes to converge (find the right answer).
This makes a bit of sense if you think of it just from the point of view of taking an average.
If you have a bunch of numbers with an average of N, but the individual numbers vary wildly from one to the next, it will take more numbers averaged together to get closer to the actual average.
If on the other hand, you have a bunch of numbers with an average of N that aren’t very different from eachother (or very different from N), it will take fewer numbers to get closer to the actual average.
Taken to the extreme, if you have a bunch of numbers with an average of N, that are all exactly the value N, it only takes one sample to get to the actual true average of N!
You can read a discussion on this here: Computer Graphics Stack Exchange: Is it expected that a naive path tracer takes many, many samples to converge?
There are lots of different ways of reducing variance of path tracing in both the sampling, as well as in the final image.
Some techniques actually just “de-noise” the final image rendered with lower sample counts. Some techniques use some extra information about each pixel to denoise the image in a smarter way (such as using a Z buffer type setup to do bilateral filtering).
Here’s such a technique that has really impressive results. Make sure and watch the video!
Nonlinearly Weighted First-order Regression for Denoising Monte Carlo Renderings
There is also a nice technique called importance sampling where instead of shooting the rays out in a uniform random way, you actually shoot your rays in directions that matter more and will get you to the actual average value faster. Importance sampling lets you get better results with fewer rays.
In the next post or two, I’ll show a very simple importance sampling technique (cosine weighted hemisphere sampling) and hope in the future to show some more sophisticated importance sampling methods.
Some Other Practical Details
Firstly, I want to mention that this is called “naive” path tracing. There are ways to get better images in less time, and algorithms that are better suited for different scenes or different graphical effects (like fog or transparent objects), but this is the most basic, and most brute force way to do path tracing. We’ll talk about some ways to improve it and get some more features in future posts.
Hitting The Wrong Objects
I wanted to mention that when you hit an object and you calculate a random direction to cast a new ray in, there’s some very real danger that the new ray you cast out will hit the same object you just hit! This is due to the fact that you are starting the ray at the collision point of the object, and the floating point math may or may not consider the new ray to hit the object at time 0 or similar.
One way to deal with this is to move the ray’s starting point a small amount down the ray direction before testing the ray against the scene. If pushed out far enough (I use a distance of 0.001) it will make sure the ray doesn’t hit the same object again. It sounds like a dodgy thing to do, because if you don’t push it out enough (how far is enough?) it will give you the wrong result, and if you push it out too far to be safe, you can miss thin objects, or can miss objects that are very close together. In practice though, this is the usual solution to the problem and works pretty well without too much fuss. Note that this is a problem in all ray tracing, not just path tracing, and this solution of moving the ray by a small epsilon is common in all forms of ray tracing I’ve come across!
Another way to deal with the problem is to give each object a unique ID and then when you cast a ray, tell it to ignore the ID of the object you just hit. This works flawlessly in practice, so long as your objects are convex – which is usually the case for ray tracing since you often use triangles, quads, spheres, boxes and similar to make your scene. However, this falls apart when you are INSIDE of a shape (like how the images at the top of this post show objects INSIDE a box), and it also falls apart when you have transparent objects, since sometimes it is appropriate for an object to be intersected again by a new ray.
I used to be a big fan of object IDs, but am slowly coming to terms with just pushing the ray out a little bit. It’s not so bad, and handles transparents and being inside an object (:
Gamma Correction
After we generate our image, we need to apply gamma correction by taking each color channel to the power of 1/2.2. A decent approximation to that is also to just take the square root of each color channel, as the final value for that color channel. You can read about why we do this here: Understanding Gamma Correction
HDR vs LDR
There is nothing in our path tracer that has any limitations on how bright something can be. We could have a bright green light that had a color value of (0, 100000, 0)! Because of this, the final pixel color may not necessarily be less than one (but it will be a positive number). Our color with be a “High Dynamic Range” color aka HDR color. You can use various tone mapping methods to turn an HDR color into an LDR color – and we will be looking at that in a future post – but for now, I am just clamping the color value between 0 and 1. It’s not the best option, but it works fine for our needs right now.
Divide by Pi?
When looking at explanations or implementations of path tracing, you’ll see that some of them divide colors by pi at various stages, and others don’t. Since proper path tracing is very much about making sure you have every little detail of your math correct, you might wonder whether you should be dividing by pi or not, and if so, where you should do that. The short version is it actually doesn’t really matter believe it or not!
Here are two great reads on the subject for a more in depth answer:
PI or not to PI in game lighting equation
Adopting a physically based shading model
Random Point on Sphere and Bias
Correctly finding a uniformly random point on a sphere or hemisphere is actually a little bit more complicated that you might expect. If you get it wrong, you’ll introduce bias into your images which will make for some strange looking things.
Here is a good read on some ways to do it correctly:
Wolfram Math World: Sphere Point Picking
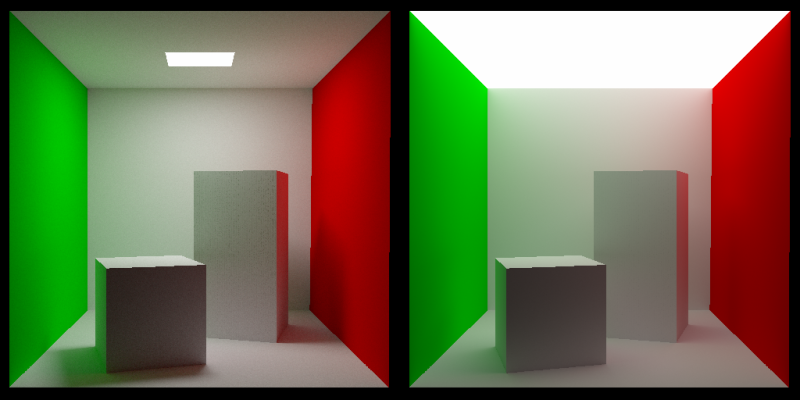
Here’s an image where the random point in sphere function was just completely wrong:

Here’s an image where the the random hemisphere function worked by picking a random point in a cube and normalizing the resulting vector (and multiplying it by -1 if it was in the wrong hemisphere). That gives too much weighting to the corners, which you can see manifests itself in the image on the left as weird “X” shaped lighting (look at the wall near the green light), instead of on the right where the lighting is circular. Apologies if it’s hard to distinguish. WordPress is converting all my images to 8BPP! :X

Primitive Types & Counts Matter
Here are some render time comparisons of the Cornell box scene rendered at 512×512, using 5 bounces and 100 samples per pixel.
There are 3 boxes which only have 5 sides – the two boxes inside don’t have a bottom, and the box containing the boxes doesn’t have a front.
I started out by making the scene with 30 triangles, since it takes 2 triangles to make a quad, and 5 quads to make a box, and there are 3 boxes.
Those 30 triangles rendered in 21.1 seconds.
I then changed it from 30 triangles to 15 quads.
It then took 6.2 seconds to render. It cut the time in half!
This is not so surprising though. If you look at the code for ray vs triangle compared to ray vs quad, you see that ray vs quad is just a ray vs triangle test were we first test the “diagonal line” of the quad, to see which of the 2 corners should be part of the ray vs triangle test. Because of this, testing a quad is just about as fast as testing a triangle. Since using quads means we have half the number of primitives, turning our triangles into quads means our rendering time is cut in half.
Lastly, i tried turning the two boxes inside into oriented boxes that have a width, height, depth, an axis of rotation and an angle of rotation around that axis. The collision test code puts the ray into the local space of the oriented box and then just does a ray vs axis aligned box test.
Doing that, i ended up with 5 quads (for the box that doesn’t have a front, it needed to stay quads, unless i did back face culling, which i didn’t want to) and two oriented boxes.
The render time for that was 5.5 seconds, so it did shave off 0.7 seconds, which is a little over 11% of the rendering time. So, it was worth while.
For such a low number of primitives, I didn’t bother with any spatial acceleration structures, but people do have quite a bit of luck on more complex scenes with bounding volume hierarchies (BVH’s).
For naive path tracing code, since the first ray hit is entirely deterministic which object it will hit (if any), we could also cache that first intersection and re-use it for each subsequent sample. That ought to make a significant difference to rendering times, but basically in the next path tracing post we’ll be removing the ability to do that, so I didn’t bother to try it and time it.
Debugging
As you are working on your path tracer, it can be useful to render an image at a low number of samples so that it’s quick to render and you can see whether things are turning out the way you want or not.
Another option is to have it show you the image as it’s rendering more and more samples per pixel, so that you can see it working.
If you make a “real time” visualizer like that, some real nice advice from Morgan McGuire (Computer graphics professor and the author of http://graphicscodex.com/) is to make a feature where if you click on a pixel, it re-renders just that pixel, and does so in a single thread so that you can step through the process of rendering that pixel to see what is going wrong.
I personally find a lot of value in visualizing per-pixel values in the image to see how values look across the pixels to be able to spot problems. You can do this by setting the emissive lighting to be based on the value you want to visualize and setting the bounce count to 1, or other similar techniques.
Below are two debug images I made while writing the code for this post to try and understand how some things were going wrong. The first image shows the normals of the surface that the camera rays hit (i put x,y,z of the normal into r,g,b but multiply the values by 0.5 and add 0.5 to make them be 0 to 1, instead of -1 to 1). This image let me see that the normals coming out of my ray vs oriented box test were correct.
The second image shows the number of bounces done per pixel. I divided the bounce count by the maximum number of bounces and used that as a greyscale value for the pixel. This let me see that rays were able to bounce off of oriented boxes. A previous image that I don’t have anymore showed darker sides on the boxes, which meant that the ray bouncing wasn’t working correctly.


Immensely Parallelizable: CPU, GPU, Grid Computing
At an image size of 1024×1024, that is a little over 1 million pixels.
At 1000 samples per pixel, that means a little over 1 billion samples.
Every sample of every pixel only needs one thing to do it’s work: Read only access to the scene.
Since each of those samples are able to do their work independently, if you had 1 billion cores, path tracing could use them all!
The example code is multithreaded and uses as many threads as cores you have on your CPU.
Since GPUs are meant for massively parallelizable work, they can path trace much faster than CPUs.
I haven’t done a proper apples to apples test, but evidence indicates something like a 100x speed up on the GPU vs the CPU.
You can also distribute work across a grid of computers!
One way to do path tracing in grid computing would be to have each machine do a 100 sample image, and then you could average all of those 100 sample images together to get a much higher sample image.
The downside to that is that network bandwidth and disk storage pays the cost of the full size image for each computer you have helping.
A better way to do it would probably be to make each machine do all of the samples for a small portion of the image and then you can put the tiles together at the end.
While decreasing network bandwidth and disk space usage, this also allows you to do all of the pixel averaging in floating point, as opposed to doing it in 8 bit 0-255 values like you’d get from a bmp file made on another machine.
Closing
In this post and the sample code that goes with it, we are only dealing with a purely diffuse (lambertian) surface, and emissive lighting. In future posts we’ll cover a lot more features like specular reflection (mirror type reflection), refraction (transparent objects), caustics, textures, bump mapping and more. We’ll also look at how to make better looking images with fewer samples and lots of other things too.
I actually have to confess that I did a bit of bait and switch. The images at the top of this post were rendered with an anti aliasing technique, as well as an importance sampling technique (cosine weighted hemisphere samples) to make the image look better faster. These things are going to be the topics of my next two path tracing posts, so be on the lookout! Here are the same scenes with the same number of samples, but with no AA, and uniform hemisphere sampling:
And the ones at the top for comparison:
While making this post I received a lot of good information from the twitter graphics community (see the people I’m following and follow them too! @Atrix256) as well as the Computer Graphics Stack Exchange.
Also, two specific individuals helped me out quite a bit:
@lh0xfb – She was also doing a lot of path tracing at the time and helped me understand where some of my stuff was going wrong, including replicating my scenes in her renderer to be able to compare and contrast with. I was sure my renderer was wrong, because it was so noisy! It turned out that while i tended to have small light sources and high contrast scenes, Lauren did a better job of having well lit scenes that converged more quickly.
@Reedbeta – He was a wealth of information for helping me understand some details about why things worked the way they did and answered a handful of graphics stack exchange questions I posted.
Thanks a bunch to you both, and to everyone else that participated in the discussions (:
