
There is 80 lines of simple standalone C++ code that generated the data for this post at:
https://github.com/Atrix256/RandomCode/blob/master/randmaxadd/Source.cpp
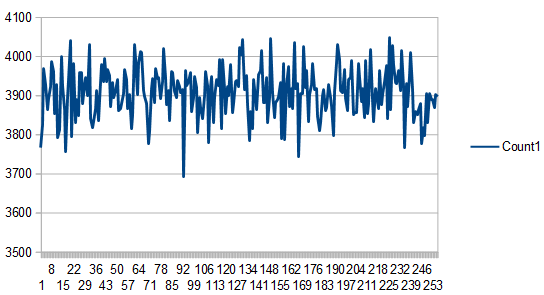
Let’s say you generate 1,000,000 random numbers from 0 to 255 and count how many times each number came up in a histogram. I did that and here it is:
In a previous post I talked about how adding dice rolls together, counting bits in a random number, and similar, would approach a normal / Gaussian distribution:
https://blog.demofox.org/2017/07/25/counting-bits-the-normal-distribution/
The same thing happens if you average random numbers, but there’s a nice side effect of getting values in the same range. That is to say: if you roll N 6 sided dice and average them, you will still get values between 1 and 6, but the more dice there are, the more the distribution will approach Gaussian. It shapes up pretty quickly too. Here is the histogram:
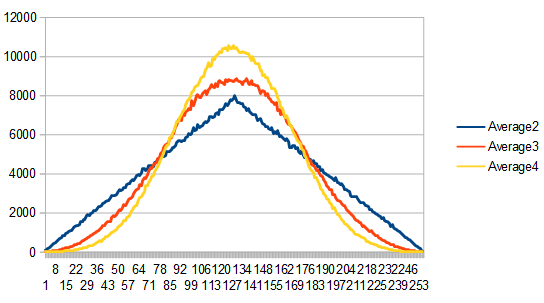
Something interesting to note is that adding two uniform random numbers together – or averaging them – makes something called “triangle distributed noise”. Looking at the histogram for averaging two values, hopefully you can see why it’s called triangle distributed! Triangle noise some cool properties for noise in graphics and is orthogonal to eg white noise vs blue noise vs low discrepancy sequences.
You can read about it in “Banding in Games”:
Click to access banding_in_games.pdf
I recently saw some code that was taking the maximum of two random numbers and that made me wonder what sort of distribution that might give.
Being a better programmer than a mathematician, i made a histogram, then took a guess as to what the formula behind the shape might be.
It turns out that taking the max of N uniform random numbers is the same as using y=x^(N-1) as a PDF. (You of course would need to normalize it to be a real PDF)
Here are the histograms:
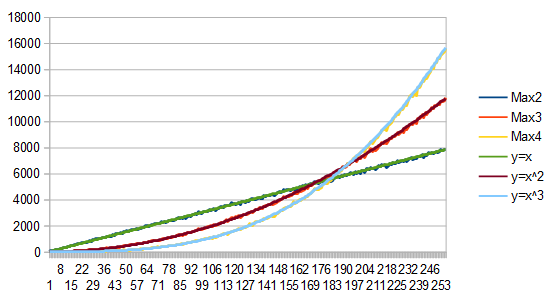
These are apparently beta distributions:
https://en.wikipedia.org/wiki/Beta_distribution
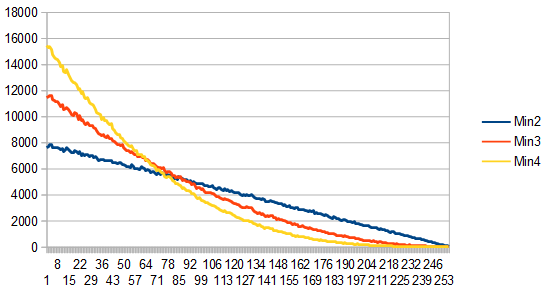
If we take the min rather than the max, what happens then? Well, if for example the numbers are between 0 and 1, taking the min will give you the same count as if you took the max of 1-x. So, the graph of the histogram should look the same, just flipped on the x axis.
It turns out that it does:

Pingback: Dice, Distributions & Noise Colors « The blog at the bottom of the sea