
First off, fuck Putin. I wish the world was giving more direct support to Ukraine against the invasion (It seems like today, that is starting to happen though luckily!). There’s too much tolerance happening for bad behavior IMO. Violence is terrible, and that’s why it has to be stopped as quickly and decisively as possible. You stop the trouble makers, you don’t just hope they’ll stop making trouble. Ukraine is fighting back hard and IMO we are all hoping they are successful, but they shouldn’t have to do this alone.

Onto the math!
For some reason, the discrete cosine transform (DCT) has been confusing to me for a long time, even though I have been intimately familiar with the discrete Fourier transform (DFT). I expected that there would be more to it than there was.
This post is a follow up to my last post, which talks about how to adjust the position of points in a point set to change the frequencies present in the point set. The last post is actually significantly more complex than this one!
There are two web demos that go with this post, that work like the demos from last post, but using the DCT instead of the DFT:
- 1D Point Set Frequencies (Cosine Transform) http://demofox.org/PointSetsCT1D.html
- 2D Point Set Frequencies (Cosine Transform) http://demofox.org/PointSetsCT2D.html
1D Signal DCT
Let’s start with a quick overview of the DFT. Here’s the formula for calculating the DFT of 1D signals.

N is the length of the signal, k is the frequency being evaluated (0 for DC, 1 for 1hz, 2 for 2hz, etc), n is the index of the current value in the signal, 

You can also express the equation like this, which explicitly breaks the sum into a sum of imaginary and real parts:

From here, if you wanted to get the magnitude of the frequency in the signal, you’d treat the real and imaginary parts of the coefficient as x and y values of a vector and get the length of the vector. If you wanted to get the phase of the frequency (how much it is offset in the signal), you use atan2(imaginary, real).
Things get a lot simpler for the DCT: we only look at the real / cosine term:

All the symbols are the same except for
That fact makes it a lot easier to get the derivative – or how changing a specific value index in the signal affects a specific frequency. If we want to know how changing the value at index m affects frequency magnitude

You can gather up this value for frequency k for each of the N values and get a gradient which will tell you how to adjust all values in the signal to increase or decrease frequency k.
You can also gather up this value for index m, for each frequency k, to get a gradient that tells you how changing this signal value affects all frequencies.
1D Point Set DCT
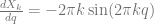
We can change the DCT formula to be for sparse values in 1D, instead of a dense N valued signal.
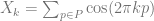
And once again, it’s super easy to get the derivative of, to know how much moving a specific point q affects the frequency.
That’s it, we are done!
You can see this in action here: http://demofox.org/PointSetsCT1D.html
2D Signal DCT
To calculate a DCT of am MxN image, we have frequency j across the x axis, multiplied by frequency k across the y axis.

If we want to take the derivative of how this frequency pair changes as the sigal value at a specific location pq changes, it’s again pretty easy. All values in the sum are constants except for the one involving the value at pq. The cosine terms are also constants in this context.

2D Point Set DCT
We can change the 2D dense signal DCT into a 2D point set DCT that looks like this:

If we want to get the derivative of frequency 


You can see this in action here: http://demofox.org/PointSetsCT2D.html
Differences Between DCT and DFT
There are some differences between using the DCT and DFT for frequency analysis and similar.
For one, the DFT assumes that the data you give it infinitely repeats. The DCT however assumes that the data you give it repeats forever too, but that each time it repeats, it is flipped like in a mirror.
Another difference is that because DFT has phase and DCT doesn’t, translation of data affects DCT frequency magnitude results, while it doesn’t affect DFT frequency magnitude results, but it does affect DFT phase results.
More concretely, imagine you have a 2hz cosine wave starting at x=0 (so, has a phase of 0 degrees). Both DFT and DCT will recognize this as a 2hz frequency with amplitude 1.
If you move this wave to the right so that it starts at x = pi/2, the DFT will still show a 2hz frequency with amplitude 1, but will now show a pi/2 phase. the DCT however, will show a 2hz frequency with amplitude -1!
If you play around in the demos that go with this post you can see this in action, that translation matters for DCT, but not for DFT, when looking at frequency magnitudes.
Lastly, DCT frequency magnitudes can be negative, where in DFT they can’t be negative. The demos are adjusted to account for this.
Once again, thanks for reading, and I hope you find this useful or at least interesting.
And here’s hoping Ukraine comes out on top soon, with friends coming to their aid and helping them rebuild. What a terrible and senseless situation.
