
The last post was on weighted reservoir sampling, one of the main techniques used in the 2020 paper “Spatiotemporal reservoir resampling for real-time ray tracing with dynamic direct lighting” (https://research.nvidia.com/sites/default/files/pubs/2020-07_Spatiotemporal-reservoir-resampling/ReSTIR.pdf). This post is on the other main technique used, which is sampling importance resampling or SIR.
SIR allows you to have a list of items from probability distribution A, and draw items from it from probability distribution B.
The C++ code that goes with this post is at https://github.com/Atrix256/ResampledImportanceSampling
SIR Algorithm
The algorithm starts with a list of values drawn from probability distribution A, assigning each value a weight of 1.
Next, you divide the weight of each item by the PDF for that item in distribution A.
You then multiply the weight of each item by the PDF for that item in distribution B, the target distribution.
Then you normalize the weights of all items in the list so they sum to 1.0.
When you use that normalized weight as a probability for choosing each item, you are drawing values from probability distribution B, even though probability distribution A was used to generate the list.
Example and Intuition
An example really helps understand this I think.
We’ll start with a small list:
4, 5, 5
Choosing an item from the list is twice as likely to give you a 5 than a 4 because there are twice as many of them. When we do uniform sampling on that list, it’s like we are doing weighted sampling of the list, where all the weights are 1. let’s put those weights in the list.
4 (1), 5 (1), 5 (1)
The probability for choosing each value in that list is this:
4: 1/3
5: 2/3
You divide the weights by those probabilities to get:
4 (3), 5 (3/2), 5 (3/2)
Or
4 (3), 5 (1.5), 5 (1.5)
Which we can normalize to this:
4 (0.5), 5 (0.25), 5 (0.25)
If you do a weighted random selection from this list using those weights, you can see that you are now just as likely to get a 4, as you are a 5. So, dividing the weights by the probabilities gave us a uniform distribution.
Now, let’s say our target distribution is that choosing a 4 should be three times as likely as choosing a 5. Here are the probabilities for that:
4: 0.75
5: 0.25
We now multiply the weights by these probabilities and get this:
4 (0.375), 5 (0.0625), 5 (0.0625)
Normalizing those weights, we get this:
4 (0.75), 5 (0.125), 5 (0.125)
If you sample from this list using those weights, there is a 75% chance you’ll get a 4, and a 25% chance you’ll get a 5.
So, even though we made this list by sampling such that a 5 was twice as likely as a 4, we can now sample from it so that a 4 is three times more likely than a 5.
The intuition here is that by dividing the weights by the probabilities that generated the list, we made the list uniform. When we multiplied the weights by the probabilities of the new distribution, it made the list take on that distribution. Not too complicated right?
Results
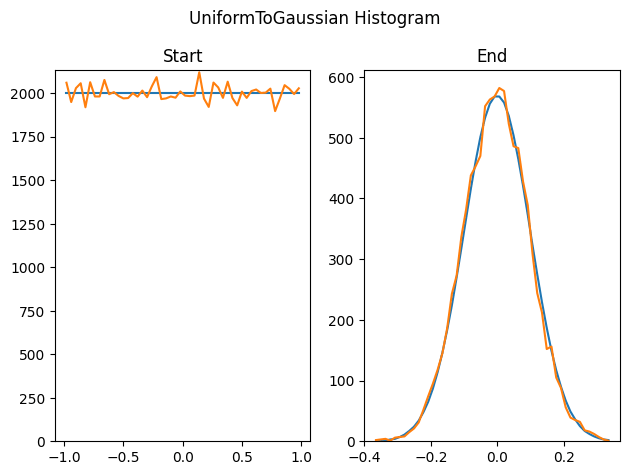
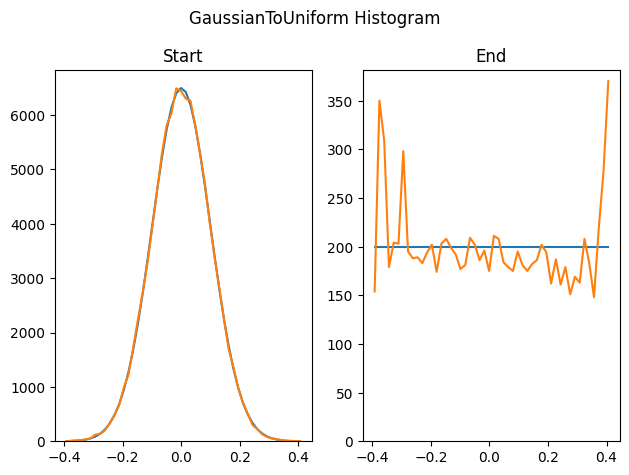
Here we use this method to generate 100,000 uniform random float values between -1 and 1, and use this technique to sample 10000 sigma 0.1 Gaussian random numbers from it. This is the starting histogram, and the sampling importance resampled values histogram.
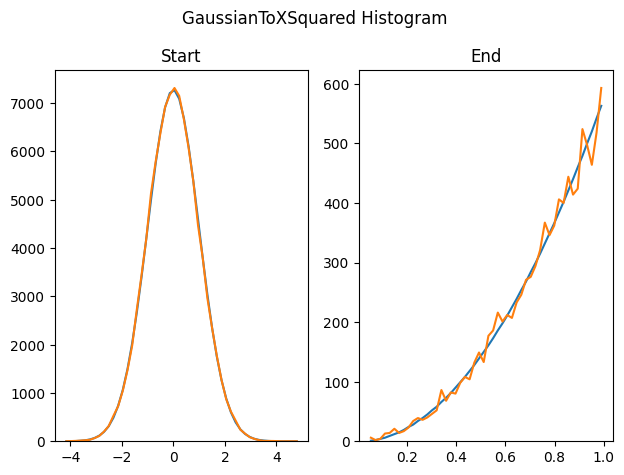
Here we start with a sigma 1.0 Gaussian distributed list of values, and resample it into a y=3x^2 PDF.
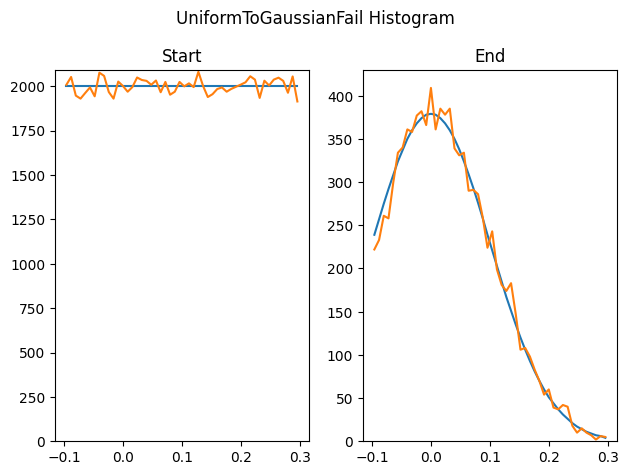
It doesn’t always work out though. This method can only output values that are in the starting list, so if the starting list doesn’t cover the full range of the target PDF, you won’t get values in the full range of the target PDF. Here we generate uniform random values between -0.1 and 0.3, and then try to resample that into a sigma 0.1 Gaussian. We can only output numbers that exist between -0.1 and 0.3, which isn’t the full range of the Gaussian.
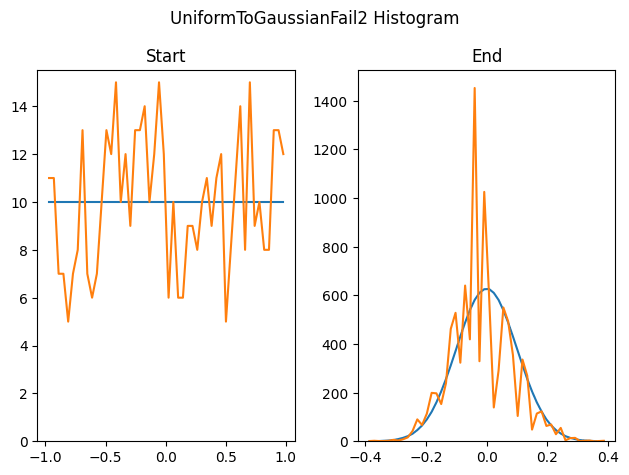
This technique can also hit problems if there aren’t enough unique values in the source list. Here we generate only 500 uniform random samples, instead of the 100,000 that we did for the previous tests, and try to turn it into a Gaussian.
Here we do the non failure uniform to gaussian test in reverse with the same number of start and end samples. It seems as though the rare events at the tail ends of the Gaussian really explode…
Other Stuff
When doing the SIR algorithm, we normalized the weights to be able to a random selection from the list. The normalized weight of an item was it’s probability of being chosen.
This means that you have to do multiple passes through the list: Once to get the sum of the weights, then again to normalize them. Now you can select items from the list randomly.
The last blog post showed us how to do a fair random selection of a weighted list in one pass though, where the weights didn’t need to be normalized. So yep, if you use reservoir sampling to sample from the weighted list, you don’t need to normalize the weights, and you can do the random weighted selection without any preprocessing. You can even calculate the weight for the item the very first time you see it (like as the result of a ray trace?), as you (fairly) consider it for weighted random selection. How cool is that?
Further, the list of samples you choose to take before resampling the importance sampling might be uniform, but it doesn’t need to be. Maybe you could do something like MIS, where you select items using one distribution, then of that distribution, you find the best item using a second distribution? Not sure if that makes sense or not.
Lastly, while talking about uniform and non uniform distributions, white noise is implied, but it need not be white noise. Gaussian blue noise is a thing, or uniform red noise. There should also be ways to use different noise colors on the input and the output, or do weighting (scoring) to promote low discrepancy or other scoring functions that have some sort of memory or awareness of other samples.
That got off onto a tangent a bit, but the point is, there is a lot of possibility here.
If you understood this post and the last, and want more, give the paper a read. You’ll be able to understand what it’s talking about, and it goes a bit deeper into some related topics and implementation details.
“Spatiotemporal reservoir resampling for real-time ray tracing with dynamic direct lighting” https://research.nvidia.com/sites/default/files/pubs/2020-07_Spatiotemporal-reservoir-resampling/ReSTIR.pdf
Thanks for reading!
Links
Video: https://www.youtube.com/watch?v=bZ2sCqj3ACU
Stack Exchange: https://stats.stackexchange.com/questions/229036/sampling-importance-resampling-why-resample/229086
