I recently watched a great 16 minute YouTube video on the basics of information theory: https://www.youtube.com/watch?v=bkLHszLlH34.
The video shows the link between probability and information entropy and a great takeaway from it is that you can use these concepts to decide what kind of experiments to do, to get as much information as possible. This could be useful if you are limited by time, computation, chemicals, or other resources. It seems like you could also mix this with “Fractional Factorial Experiment Design” somehow (https://blog.demofox.org/2023/10/17/fractional-factorial-experiment-design-when-there-are-too-many-experiments-to-do/).
Probability and Bits
Information theory links probability to bits of information using this formula:

where p is the probability of an event happening, and b is the number of bits generated by that event.
Using a fair coin as an example, there is a 50% (1/2) chance of heads and a 50% (1/2) chance of tails. In both cases, p=0.5. Let’s calculate how many bits flipping a head gives us:

So flipping a coin and getting heads would give us 1 bit, and so would getting tails, since it has the same probability. This makes some perverse sense, since we can literally generate random bits by flipping a coin and using Heads / Tails as 0 / 1.
What if we had a weighted coin that had a 75% (3/4) chance of heads, and a 25% (3/4) chance of tails?


So, flipping a heads gives us only 0.415 bits of information, but flipping tails gives us 2 bits of information. When something is lower probability, it’s more surprising when it happens, and it gives us more bits.
What if we had a two headed coin so that flipping heads was a 100% (1/1) chance, and tails was a 0% (0/1) chance?


The math says that flipping a 2 headed coin is a deterministic result and gives us no bits of information!
Submarine Game
The submarine game is a simplified and single player version of battleship where you have a grid of MxN cells, and one of the cells contains a submarine. The game is to guess a cell to attack, and it’s revealed whether the submarine was there or not. The game ends when the submarine is found.
At each step in the game, if there are U cells which are covered, there is a 1/U chance of shooting the submarine and a (U-1)/U chance of missing the submarine.
You can think of this a different way: The goal is to find the position of the submarine, and if you miss the submarine, you eliminate one of the possibilities, giving you some more information about where the submarine is by showing you where it isn’t and narrowing down the search. If you hit the submarine, you get all remaining information and the game ends.
If you had a 4×4 grid, there are 16 different places the submarine could be in, so you could store the position in 4 bits. Every time you miss the submarine, you gain a fraction of those bits. When you eventually hit the submarine you gain the remaining fraction of those bits!
Let’s see this in action with a smaller 4×1 grid. With only 4 cells, the submarine position can be encoded with 2 bits, so 2 bits is the total amount of information we are trying to get.
Turn 1
| ? | ? | ? | ? |
On the first turn we can choose from 4 cells to reveal. 3 cells are empty, and 1 cell is the submarine, so we have a 75% (3/4) chance of missing the submarine, and a 25% (1/4) chance of hitting it. Lets calculate how many bits of information each would give us:


This shows that if we find the submarine, we gain the full 2 bits of information all at once. Otherwise, we gain 0.415 bits of information.
Turn 2
| Miss | ? | ? | ? |
If we got to the second turn, we missed on the first turn and have accumulated 0.415 bits of information. There are 3 cells to reveal. 2 cells are empty and 1 has the submarine. There is a 66% (2/3) chance to miss the submarine, and a 33% (1/3) chance to hit the submarine.


If we hit the submarine, we get 1.585 bits of information to add to the 0.415 bits of information we got in the first turn, which adds together to give us the full 2 bits of information needed to locate the submarine. Otherwise, we gain 0.585 more bits of information giving us 0.415+0.585=1 bits of info total, and continue on to turn 3.
Turn 3
| Miss | Miss | ? | ? |
On turn 3 there are 2 cells to reveal. 1 cell is empty and 1 has the submarine, so there is a 50% (1/2) chance for either missing or hitting the submarine. We also have accumulated 1 bit of information, which makes sense because we’ve eliminated half of the cells and have half the number of bits we need.


If we hit the submarine, it gives us the other bit we need, and if we miss the submarine, it also gives us the other bit we need. Either we hit the submarine and know where it is, or we revealed the final cell that doesn’t have the submarine in it, so we know the submarine is in the final unrevealed cell.
If we missed, let’s continue onto Turn 4, even though we have accumulated 2 bits of information already.
Turn 4
| Miss | Miss | Miss | ? |
On turn 4 there is 1 cell to reveal. 0 cells are empty and 1 has the submarine, so there is a 100% (1/1) chance to hit the submarine, and 0% (0/1) chance to miss. We also already have 2 bits of information accumulated from the previous rounds, while only needing 2 bits of information total to know where the submarine is.


The math tells us that we got no new information from revealing the final cell. It was completely deterministic and we knew the outcome already. Turn 4 was not necessary.
Neat, isn’t it?
| Miss | Miss | Miss | Hit |
Expected Information Entropy
Besides being able to calculate the number of bits we’d get from a possible result, we can also look at all possibilities of an event simultaneously and get an expected number of bits to get from the event. You calculate this by calculating the bits for each possible event, multiplying by the probability, and summing them all up.
Fair Coin
Going back to the coin example, with a fair coin, there is a 50% (1/2) chance of landing heads, and a 50% (1/2) chance of being tails. Let’s calculate the number of bits that gives us again:


We then multiply them each by their probability of coming up and add them together. That is a weighted of the number of bits the events generate, weighted by their probability of happening.


So, the expected number of bits generated from a fair coin flip is 1 bit.
I’m using the notion 


Unfair (Biased) Coin
How about the unfair coin that had a 75% (3/4) chance of heads, and a 25% (3/4) chance of tails?
Now let’s multiply each by their probability and add them together:


The biased coin gave us less information on average than the fair coin. The fair coin gave 1 bit, while this unfair coin only gave 0.811 bits. Interesting!
Fair Coin + Edge (Unfair 3 Sided Coin)
Let’s run the numbers for a coin where there’s a 49% chance to land heads, a 49% chance to land tails, and a 2% chance to land edge on.


Now let’s calculate the expected information entropy:


Equal Chance For Heads, Tails, Edge (Fair 3 Sided Coin)
Lastly, let’s do the math for a coin that has equal chances of landing heads, tails, or edge. All of them being a 33% (1/3) chance.

Tails and edge have the same probability so same number of bits. If we take the weighted average of that, since they are all the same, we get:

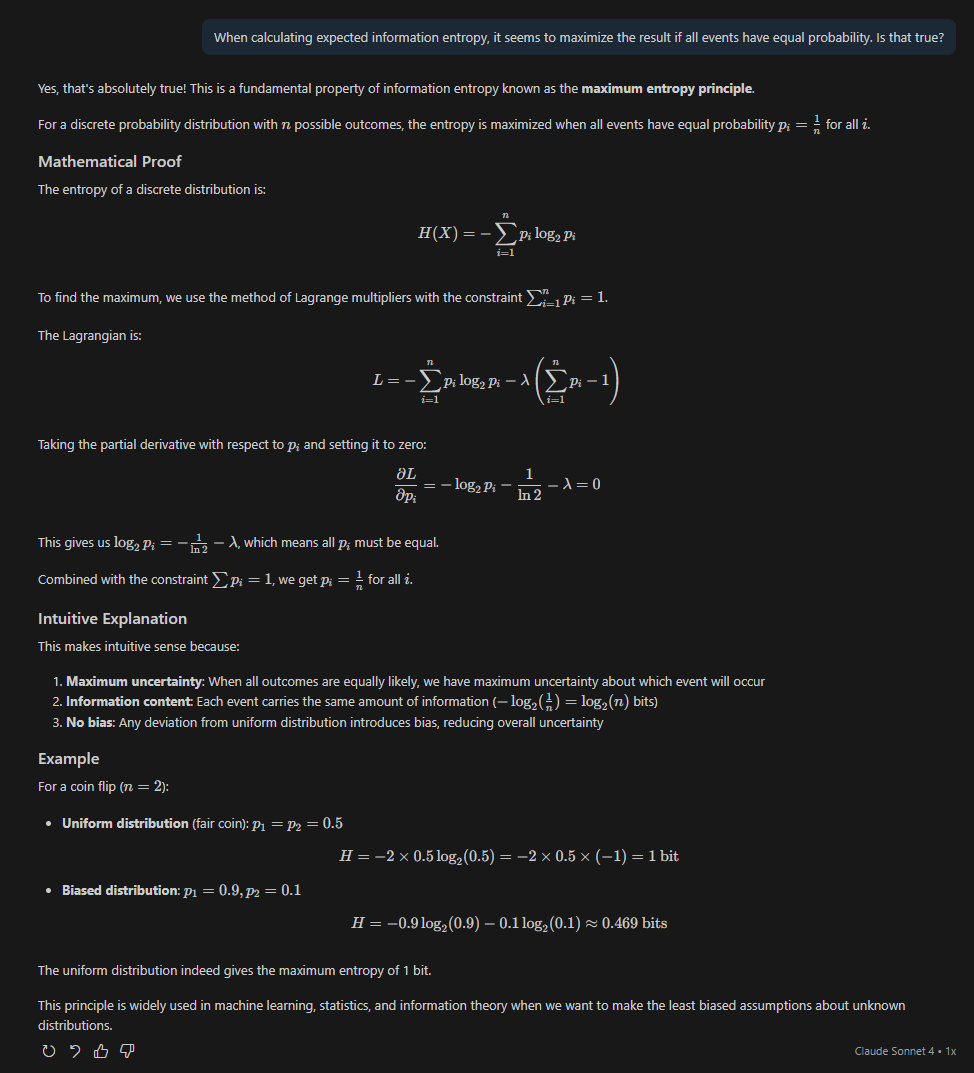
It looks to me that the expected bits are highest when the probabilities are equal. I asked Claude who said that is true, and gave a proof I could follow, as well as an intuitive explanation.
Using Expected Information Entropy To Choose Experiments
The video has a neat question they use “Expected Information Entropy” to solve:
Imagine you have 12 balls. 11 of them weigh the same, but 1 ball is either heavier or lighter than the others. You have a scale to help you figure out which ball is the “odd ball”. What is your strategy for finding it using the least number of weighings as possible?
Tangent: My 11 year old son Loki said the answer was 2 if you get lucky. Put one ball on each side of the scale, and if one of them is the odd ball, the scale will show an uneven weight. Replace one of the balls with another ball from the pile. If the scale goes flat, the ball that was removed was the “odd ball”, else it’s the ball that did not get removed. This answer relies on luck, but it is the minimum number of weighings possible.
For the “real” solution, the video wants you to instead think about the lowest number of EXPECTED weighings.
For the first weighing you have to decide how many balls to put on the left and right side of the scale.
We actually know that there are 3 possible outcomes of this are:
- The left side of the scale goes down.
- The right side of the scale goes down.
- The scale is level.
If we decide how many balls to put on each side, we can calculate the probabilities of the outcomes.
1 Ball Each Side
For 1 ball on each side:
- The left side of the scale goes down. 1/12 chance.
- The right side of the scale goes down. Also a 1/12 chance.
- The scale is level. a 10/12 chance.
If it doesn’t make sense to you how I came up with these probabilities, the next section explains it.
Since we know the outcomes and their probabilities, we can calculate the expected entropy information!


Putting 1 ball on each side for the first weighing gives us 0.817 bits of information on average.
2 Balls Each Side
- The left side goes down: 2/12 chance
- The right side goes down: 2/12 chance
- The scale is level: 8/12 chance


Putting 2 balls on each side gives us 1.252 bits of information on average.
The Rest
We could calculate the rest of them, but I’ll show you the final chart and leave it up to you to calculate them all if you want to!
| Balls On Each Side | Expected Information Entropy |
| 1 | 0.82 |
| 2 | 1.25 |
| 3 | 1.50 |
| 4 | 1.58 |
| 5 | 1.48 |
| 6 | 1.0 |
As you can see, weighing 4 balls gives the most expected information entropy. On average, it’s the best thing to do for the first weighing. Something interesting is that when you put 4 balls on each side, there are 4 balls left on the table, so it is equal chance that the scale tilts left, lays flat, or tilts right. Just like we saw at the end of the last section, having 3 options with equally probable events gives the most expected information entropy.
A good heuristic to take away from all of this seems to be that if you are trying to decide what kind of measurement or experiment to do next, you should do whichever one has as close to even probabilities of all outcomes as possible.
I feel like this must relate to dimensionality reduction (like PCA or SVD), where you find a lower dimensional projection that has the most variance.
The video explains what to do after you do the first ball weighing, but it essentially comes down to calculating the expected information entropy for the next set of outcomes, and choosing the highest one. It turns out you can isolate the ball with 3 weighings total, when you work this way.
Bonus: Calculating Odds Of Scale Results
This is what makes sense to me. Your mileage may vary.
Let’s say we have 3 balls and label them A,B,C. A is the odd ball and is heavier than B and C. There are 6 ways to arrange these letters.
ABC
ACB
BAC
BCA
CAB
CBA
If we take the left letter of the strings above to be what is on the left side of the scale, the middle letter means what is on the right side of the scale, and the right letter means what is left on the table, we have our 6 possible ball configurations.
Out of those configurations, 2 out of 6 have A on the left of the scale, so the scale tilts to the left. 2 of the 6 have A on the right of the scale, so the scale tilts to the right. The last 2 of the 6 have A on the table, so the scale is flat. If A was light instead of heavy, you just reverse the tilt left and tilt right but everything else stays the same.
In the problem asked, there are 12 balls though, which are a lot more letters. In general, for N letters representing N balls, there are N! ways to arrange those letters. Each letter appears in each position an equal number of times, which is (N-1)! ways. So, the percentage of the time a letter is in a specific column is (N-1)! / (N!), or 1/N. Another way to get here is to just realize that every column has every letter in it the same number of times, so with N letters, each letter appears in the column 1/N percent of the time.
For 1 ball on each side, for our 3 cases we just count:
- Tilt Left: The percentage of times the oddball “A” is in the first column (1/12).
- Tilt Right: The percentage of times the oddball “A” is in the second column (1/12).
- Flat: The remainder to make the percentages add up to 1 (12/12 – 1/12 – 1/12 = 10/12).
So for 12 balls, it’s 1/12 for each of the tilt directions, leaving 10/12 as the remainder, for the odd ball to be on the table.
For 2 balls on each side, we count:
- Tilt Left: The percentage of times the oddball “A” is in the first column or second column (1/12 + 1/12 = 2/12).
- Tilt Right: The percentage of times the oddball “A” is in the third column or fourth column (1/12 + 1/12 = 2/12).
- Flat: the remainder (12/12 – 2/12 – 2/12 = 8/12).
So, it’s 2/12 for each of the tilt directions, and 8/12 for the remainder.
The pattern continues for higher ball counts being weighed.
Hopefully you found this post interesting. Thanks for reading!
 , we can calculate the derivative as
  . Here are those two functions graphed.

 and wanted to know whether you should go left or right to get lower, the derivative can tell you. Plugging 1 into
  gives the value -4. A negative derivative means taking a step to the right will make the y value go down, so going right is down hill. We could take a step to the right and check the derivative again to see if we’ve walked far enough. As we are taking steps, if the derivative becomes positive, that means we went too far and need to turn around, and start going left. If we shrink our step size whenever we go too far in either direction, we can get arbitrarily close to the actual minimum point on the graph.
 and getting the value
  . Without iteration, we found that the minimum of the function is at
  term of a quadratic is negative, then it only has a maximum, instead of a minimum.
 that is a local minimum for x but a local maximum for y. The gradient will be zero in each direction, despite it not being a minimum, and the simulated ball will get stuck.
 , a gradient is a vector of derivatives, where you consider changing only one variable at a time, leaving the other variables constant. The notation for a gradient looks like this:
 , that means “The derivative of w with respect to x”. Another way of saying that is “If you added 1 to x before plugging it into the function, this is how much w would change, if the function was a straight line”. These are called partial derivatives, because they are derivatives of one variable, in a function that takes multiple variables.
 .
. .
. .
. .
. .
. .
.


 . The value
  is what number is on the dice face, and the value
  says how many faces have that value.


 so that
  is 0.
is 0. because it makes all the
  power terms go away and leaves only the value of
  .
. because that will make all


 . The only way that can be true is if each dice has the
  . If we plug 1 in for


 , the
, the  which simplifies to:
 .
.


 can be true, when
 ![A,B,C \in [0,6]](https://s0.wp.com/latex.php?latex=A%2CB%2CC+%5Cin+%5B0%2C6%5D&bg=ffffff&fg=666666&s=0&c=20201002) .
. . If we want to do that three times – once for A, once for B, once for C – and add them together, we multiply that generating function by itself three times, aka we cube it.

 is 28, which means there are 28 different ways to add the three numbers between 0 and 6 together, to get 12.


 into infinity, but we know there are 20 jellybeans total, so we can stop at 20.