
This is a gentle explanation of blue noise and how it can be useful.
We’ll start with something simple that we can all get behind – not getting eaten by a cheetah!

Let’s talk about our eyes for a minute.
Our eyes have about 126 million photo receptors in them – about 6 million cones, 120 million rods (source). These photo receptors give your brain an image of the world around you. They are a bit like pixels because they are just small points of data that your brain combines into an image.
How those photo receptors are arranged in your eye can make a big difference. Imagine for a second that we only had 10 photo receptors. If they were laid out like these blue dots, we wouldn’t be able to see the cheetah and we’d become a tasty cat snack.
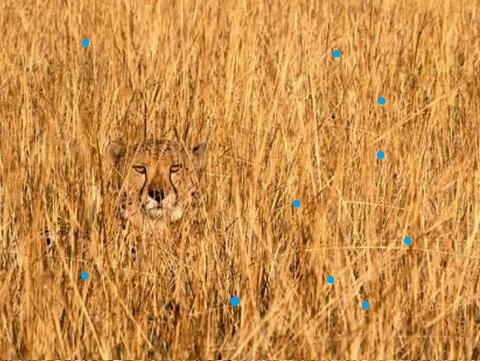
In the image above, white noise random numbers were used to place the points. White noise is what most people are talking about when they talk about random numbers. Using white noise to generate numbers, the numbers can clump up in some spots and leave empty holes in other spots. When using white noise to lay out photo receptors, that makes it so some photo receptors give redundant information when they are too close together, and leave big open spaces in your vision where you are not getting any information at all. Not good!
What if the dots were laid out like this instead?
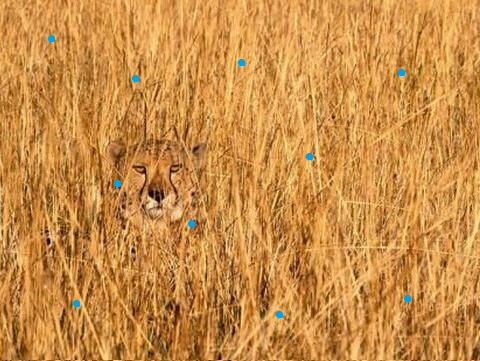
The points are still randomly placed, but they are roughly evenly spaced. This makes it so we get the most bang for our buck from the photo receptors. We basically have the maximum amount of information we can get for the number of photo receptors we have to work with.
In this case, two of the photo receptors are on the cat, so we have some information about that predator, and we have a better chance at reacting before we become lunch!
Blue noise random numbers were used to place the points on this image, and this example shows exactly why blue noise can be better than white noise – you get maximal information with fewer samples.
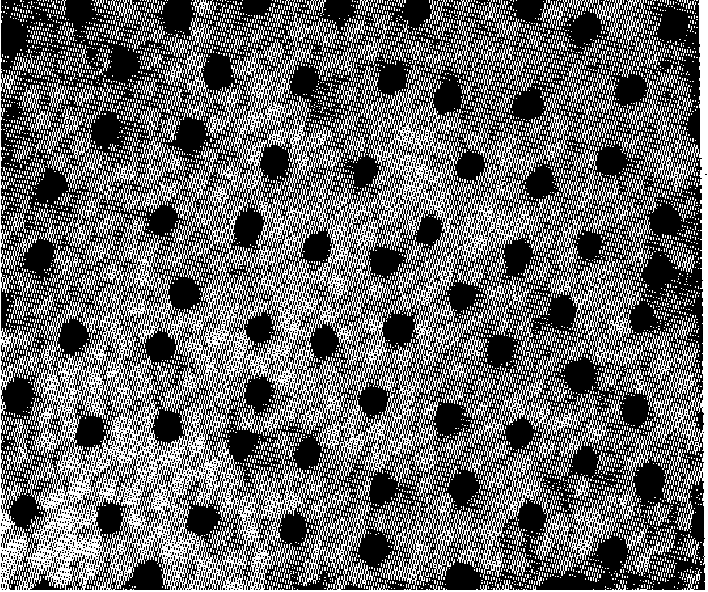
Interestingly, our photo receptors (as well as other animals) are in fact laid out this way. Here is an image of a primate (macaque) retina (source)
You might also find this an interesting read about chicken eyes which also have blue noise properties:
https://www.princeton.edu/news/2014/02/24/eye-chicken-new-state-matter-comes-view
That’s blue noise in a nut shell, but continue on if you’d like to go just a tad bit deeper.
A Little More Technical
If maximizing information is the goal, you might wonder why blue noise is better than putting the sample points in a grid, or in a honeycomb structure or some other regular pattern. The short answer is that regular patterns have a problem called “aliasing”. Random numbers in general trade the problem of aliasing for the problem of noise, but blue noise random numbers in particular still get the benefits of “roughly even coverage”, so blue noise is the best of both worlds.
Blue noise is difficult / computationally intensive to generate though, compared to white noise or regular sampling. Generating better blue noise more efficient is in fact is an ongoing area of research!
For a deeper comparison of white noise, blue noise, and regular sampling, and also how to generate blue noise sample points, give this a read: https://blog.demofox.org/2017/10/20/generating-blue-noise-sample-points-with-mitchells-best-candidate-algorithm/
If you want at least some of the benefits of blue noise, but don’t want to spend the resources to compute it, a nice alternative might be low discrepancy sequences. You can read about them (and how to generate them) here: https://blog.demofox.org/2017/05/29/when-random-numbers-are-too-random-low-discrepancy-sequences/
You often hear about blue noise and low discrepancy sequences in graphics / in numerical integration. For low sample counts, the blue noise / LDS’s give you more even spaces for your samples in the sampling domain, but I’ve heard that white noise gives you better results for larger sample counts.
There is a whole rainbow of noises possible, each with their own unique usage cases. If you want to know a way to transmute white noise to other colors of noises, give this a read: https://blog.demofox.org/2017/10/25/transmuting-white-noise-to-blue-red-green-purple/
Lastly, the other day I found out that Tempurpedic beds are the best, because they have some secret formula/process they bought from NASA. This recipe allows them to make memory foam such that the bubbles are all roughly the same size. The foam is not arranged into any regular structure such as a grid or a honeycomb, so in essence, the memory foam is blue noise. More specifically, it’s basically the Voronoi diagram of blue noise distributed sample points in 3d.
So, Tempurpedic is the best because they have blue noise foam.
Weird, right?!

Pingback: Monte Carlo Integration Explanation in 1D « The blog at the bottom of the sea
Pingback: CPU-based Path-tracer – Clément Pirelli : Portfolio
There are many angles onto which you can consider the “blue noise” thing. Spectrum is one. Discrepancy is another. A stats oriented one is “stratified sampling”, as an accelerator of convergence ( thus the “quota method” in opinion polls ).
Now there are also many traps, starting with using the name “blue noise” instead of “low-discrepancy” or “Poisson-disc distribution”. “blue” only refer to the spectrum, which is missleading since having a blue spectrum does not imply at all that the distribution is even. Even distribution is at first about correlations, which is massively about phases, not power spectrum. For instance, this is blue noise (with random phases): https://www.shadertoy.com/view/4dGGz1 .
Another trap is the difference between a statistical process vs instances. E.g. optimizing Poisson disk often leads to regular hexagonal grids. But since the angle and offset change at each instance, the process PSD is still perfectly blue (or ring, here).
Yet another trap is that Fourier is global, and thus blind to local properties. E.g. the above optimization can leads locally to hexa grid, with angle and offset changing from place to place. Then for Fourier it is still blue. ( previous case was “time” stats, here it’s space stats, but both are blind to non-stationarity of properties ).
LikeLiked by 1 person
Pingback: Fooling Around with Foveated Rendering · Covid19's News